Market Volatility: The Best Days and Worst Days Travel Together
The stock market’s best and worst days tend to arrive together, and the early months of 2026 offered a timely reminder.
For your convenience, we’ve also provided a PDF copy of the Chart of the Month | Market Volatility: The Best Days and Worst Days Travel Together
The S&P 500 fell nearly -10% from its late-January high through the end of March as the U.S.-Iran conflict sent oil prices surging more than +60%. Headlines about the Strait of Hormuz closure, rising energy costs, and the potential economic impact created an environment that can tempt investors to move to cash. But acting on that impulse would have meant missing the recovery that followed when ceasefire talks emerged in late March. It is a well-documented pattern: trying to avoid the worst days often means missing the best days.
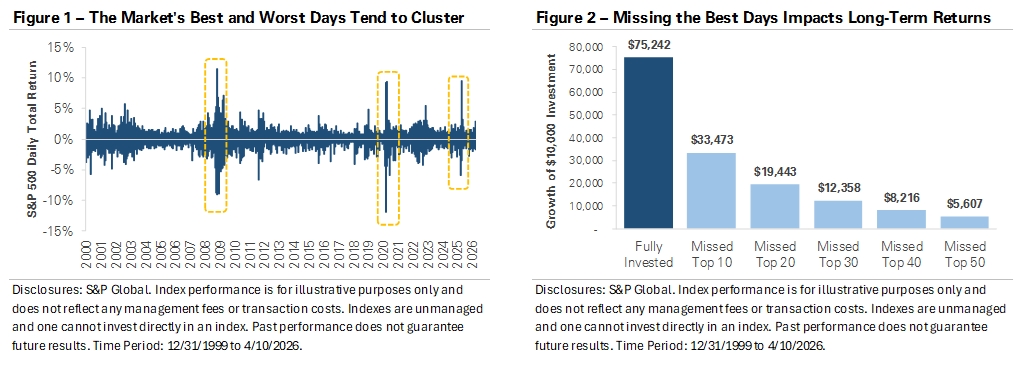
Figure 1 illustrates this dynamic. The chart graphs the S&P 500’s daily returns over the past 26 years, showing that the market’s largest daily moves cluster together rather than occurring in isolation. The biggest single-day selloffs during the 2008 financial crisis, the 2020 pandemic, and the 2025 tariff volatility were each surrounded by some of the largest single-day gains. The pattern showed up again during the recent volatility: the S&P 500 posted its strongest daily return since April 2025 amid optimism for a U.S.-Iran ceasefire, only days after escalating tensions pushed stocks lower. The same environments that produce sharp selloffs often set the stage for strong rallies.
Figure 2 puts a dollar amount on the cost of mistiming the market. A $10,000 investment in the S&P 500 on December 31, 1999, would have grown to $75,242, a more than seven-fold increase over a period that included the dot-com bust, the financial crisis, and a global pandemic. Missing just the 10 best trading days cuts that ending value to $33,473, less than half the fully invested result. The damage compounds quickly from there: missing the top 20 days reduces the value to $19,443, missing the top 30 lowers it to $12,358, and missing the 50 best days shrinks the original $10,000 to $5,607, a loss of more than -40% during a period when the market delivered strong returns.
This year’s market volatility may feel unsettling, but it reinforces a core principle: selling during a decline locks in losses and creates a difficult re-entry problem. Investors who moved to the sidelines during March’s selloff and waited for calmer conditions likely missed a significant portion of the recovery. A well-constructed financial plan accounts for periods of market stress, and strategies like maintaining a diversified portfolio, keeping an appropriate cash reserve, and rebalancing periodically can help investors stay the course. The market rewards patience, and as the first quarter showed, mistiming it can be costly.
Disclosure
The information and opinions provided herein are provided as general market commentary only – not financial advice – and are subject to change at any time without notice. This commentary may contain forward-looking statements that are subject to various risks and uncertainties. None of the events or outcomes mentioned here may come to pass, and actual results may differ materially from those expressed or implied in these statements. No mention of a particular security, index, or other instrument in this report constitutes a recommendation to buy, sell, or hold that or any other security, nor does it constitute an opinion on the suitability of any security or index. The report is strictly an informational publication and has been prepared without regard to the particular investments and circumstances of the recipient.
Past performance does not guarantee or indicate future results. Any index performance mentioned is for illustrative purposes only and does not reflect any management fees, transaction costs, or expenses. Indexes are unmanaged, and one cannot invest directly in an index. Index performance does not represent the actual performance that would be achieved by investing in a fund.
See Full Disclosures Page
Concerns or questions about how your investment portfolio will hold up in the current market environment? Contact Financial Synergies today.
We are a boutique, financial advisory and total wealth management firm with over 35 years helping clients navigate turbulent markets. To learn more about our approach to investment management please reach out to us. One of our seasoned advisors would be happy to help you build a custom financial plan to help ensure you accomplish your financial goals and objectives. Schedule a conversation with us today.
More relevant articles by Financial Synergies:
Blog Disclosures
This content, which may contain security-related opinions and/or information, is provided for informational purposes only and should not be relied upon in any manner as professional advice, or an endorsement of any practices, products or services. There can be no guarantees or assurances that the views expressed here will be applicable for any particular facts or circumstances, and should not be relied upon in any manner. You should consult your own financial advisors as to legal, business, tax, and other related matters concerning any investment.
The commentary in this “post” (including any related blogs, videos, and social media) reflects the personal opinions, viewpoints, and analyses of the Financial Synergies Wealth Advisors, Inc. employees providing such comments, and should not be regarded as the views of Financial Synergies Wealth Advisors, Inc. or its respective affiliates or as a description of advisory services provided by Financial Synergies Wealth Advisors, Inc. or performance returns of any Financial Synergies Wealth Advisors, Inc. client.
Any opinions expressed herein do not constitute or imply endorsement, sponsorship, or recommendation by Financial Synergies Wealth Advisors, Inc. or its employees. The views reflected in the commentary are subject to change at any time without notice.
Nothing on this website or Blog constitutes investment or financial planning advice, performance data or any recommendation that any particular security, portfolio of securities, transaction or investment strategy is suitable for any specific person. It also should not be construed as an offer soliciting the purchase or sale of any security mentioned. Nor should it be construed as an offer to provide investment advisory services by Financial Synergies Wealth Advisors, Inc.
Any mention of a particular security and related performance data is not a recommendation to buy or sell that security. Financial Synergies Wealth Advisors, Inc. manages its clients’ accounts using a variety of investment techniques and strategies, which are not necessarily discussed in the commentary. Investments in securities involve the risk of loss. Past performance is no guarantee of future results.
Any charts provided here or on any related Financial Synergies Wealth Advisors, Inc. personnel content outlets are for informational purposes only, and should also not be relied upon when making any investment decision. Any indices referenced for comparison are unmanaged and cannot be invested into directly. As always please remember investing involves risk and possible loss of principal capital; please seek advice from a licensed professional. Any projections, estimates, forecasts, targets, prospects and/or opinions expressed in these materials are subject to change without notice and may differ or be contrary to opinions expressed by others. Information in charts have been obtained from third-party sources and data, and may include those from portfolio securities of funds managed by Financial Synergies Wealth Advisors, Inc. While taken from sources believed to be reliable, Financial Synergies Wealth Advisors, Inc. has not independently verified such information and makes no representations about the enduring accuracy of the information or its appropriateness for a given situation. All content speaks only as of the date indicated.
Financial Synergies Wealth Advisors, Inc. is a registered investment adviser. Advisory services are only offered to clients or prospective clients where Financial Synergies Wealth Advisors, Inc. and its representatives are properly licensed or exempt from licensure. Investments in securities involve the risk of loss. Past performance is no guarantee of future results.
See Full Disclosures Page Here
 Skip to content


Chart of the Month | Market Volatility: The Best Days and Worst Days Travel Together
Market Volatility: The Best Days and Worst Days Travel Together
The stock market’s best and worst days tend to arrive together, and the early months of 2026 offered a timely reminder.
For your convenience, we’ve also provided a PDF copy of the Chart of the Month | Market Volatility: The Best Days and Worst Days Travel Together
The S&P 500 fell nearly -10% from its late-January high through the end of March as the U.S.-Iran conflict sent oil prices surging more than +60%. Headlines about the Strait of Hormuz closure, rising energy costs, and the potential economic impact created an environment that can tempt investors to move to cash. But acting on that impulse would have meant missing the recovery that followed when ceasefire talks emerged in late March. It is a well-documented pattern: trying to avoid the worst days often means missing the best days.
Figure 1 illustrates this dynamic. The chart graphs the S&P 500’s daily returns over the past 26 years, showing that the market’s largest daily moves cluster together rather than occurring in isolation. The biggest single-day selloffs during the 2008 financial crisis, the 2020 pandemic, and the 2025 tariff volatility were each surrounded by some of the largest single-day gains. The pattern showed up again during the recent volatility: the S&P 500 posted its strongest daily return since April 2025 amid optimism for a U.S.-Iran ceasefire, only days after escalating tensions pushed stocks lower. The same environments that produce sharp selloffs often set the stage for strong rallies.
Figure 2 puts a dollar amount on the cost of mistiming the market. A $10,000 investment in the S&P 500 on December 31, 1999, would have grown to $75,242, a more than seven-fold increase over a period that included the dot-com bust, the financial crisis, and a global pandemic. Missing just the 10 best trading days cuts that ending value to $33,473, less than half the fully invested result. The damage compounds quickly from there: missing the top 20 days reduces the value to $19,443, missing the top 30 lowers it to $12,358, and missing the 50 best days shrinks the original $10,000 to $5,607, a loss of more than -40% during a period when the market delivered strong returns.
This year’s market volatility may feel unsettling, but it reinforces a core principle: selling during a decline locks in losses and creates a difficult re-entry problem. Investors who moved to the sidelines during March’s selloff and waited for calmer conditions likely missed a significant portion of the recovery. A well-constructed financial plan accounts for periods of market stress, and strategies like maintaining a diversified portfolio, keeping an appropriate cash reserve, and rebalancing periodically can help investors stay the course. The market rewards patience, and as the first quarter showed, mistiming it can be costly.
Disclosure
The information and opinions provided herein are provided as general market commentary only – not financial advice – and are subject to change at any time without notice. This commentary may contain forward-looking statements that are subject to various risks and uncertainties. None of the events or outcomes mentioned here may come to pass, and actual results may differ materially from those expressed or implied in these statements. No mention of a particular security, index, or other instrument in this report constitutes a recommendation to buy, sell, or hold that or any other security, nor does it constitute an opinion on the suitability of any security or index. The report is strictly an informational publication and has been prepared without regard to the particular investments and circumstances of the recipient.
Past performance does not guarantee or indicate future results. Any index performance mentioned is for illustrative purposes only and does not reflect any management fees, transaction costs, or expenses. Indexes are unmanaged, and one cannot invest directly in an index. Index performance does not represent the actual performance that would be achieved by investing in a fund.
See Full Disclosures Page
Concerns or questions about how your investment portfolio will hold up in the current market environment? Contact Financial Synergies today.
We are a boutique, financial advisory and total wealth management firm with over 35 years helping clients navigate turbulent markets. To learn more about our approach to investment management please reach out to us. One of our seasoned advisors would be happy to help you build a custom financial plan to help ensure you accomplish your financial goals and objectives. Schedule a conversation with us today.
More relevant articles by Financial Synergies:
Blog Disclosures
This content, which may contain security-related opinions and/or information, is provided for informational purposes only and should not be relied upon in any manner as professional advice, or an endorsement of any practices, products or services. There can be no guarantees or assurances that the views expressed here will be applicable for any particular facts or circumstances, and should not be relied upon in any manner. You should consult your own financial advisors as to legal, business, tax, and other related matters concerning any investment.
The commentary in this “post” (including any related blogs, videos, and social media) reflects the personal opinions, viewpoints, and analyses of the Financial Synergies Wealth Advisors, Inc. employees providing such comments, and should not be regarded as the views of Financial Synergies Wealth Advisors, Inc. or its respective affiliates or as a description of advisory services provided by Financial Synergies Wealth Advisors, Inc. or performance returns of any Financial Synergies Wealth Advisors, Inc. client.
Any opinions expressed herein do not constitute or imply endorsement, sponsorship, or recommendation by Financial Synergies Wealth Advisors, Inc. or its employees. The views reflected in the commentary are subject to change at any time without notice.
Nothing on this website or Blog constitutes investment or financial planning advice, performance data or any recommendation that any particular security, portfolio of securities, transaction or investment strategy is suitable for any specific person. It also should not be construed as an offer soliciting the purchase or sale of any security mentioned. Nor should it be construed as an offer to provide investment advisory services by Financial Synergies Wealth Advisors, Inc.
Any mention of a particular security and related performance data is not a recommendation to buy or sell that security. Financial Synergies Wealth Advisors, Inc. manages its clients’ accounts using a variety of investment techniques and strategies, which are not necessarily discussed in the commentary. Investments in securities involve the risk of loss. Past performance is no guarantee of future results.
Any charts provided here or on any related Financial Synergies Wealth Advisors, Inc. personnel content outlets are for informational purposes only, and should also not be relied upon when making any investment decision. Any indices referenced for comparison are unmanaged and cannot be invested into directly. As always please remember investing involves risk and possible loss of principal capital; please seek advice from a licensed professional. Any projections, estimates, forecasts, targets, prospects and/or opinions expressed in these materials are subject to change without notice and may differ or be contrary to opinions expressed by others. Information in charts have been obtained from third-party sources and data, and may include those from portfolio securities of funds managed by Financial Synergies Wealth Advisors, Inc. While taken from sources believed to be reliable, Financial Synergies Wealth Advisors, Inc. has not independently verified such information and makes no representations about the enduring accuracy of the information or its appropriateness for a given situation. All content speaks only as of the date indicated.
Financial Synergies Wealth Advisors, Inc. is a registered investment adviser. Advisory services are only offered to clients or prospective clients where Financial Synergies Wealth Advisors, Inc. and its representatives are properly licensed or exempt from licensure. Investments in securities involve the risk of loss. Past performance is no guarantee of future results.
See Full Disclosures Page Here
Recent Posts
Happy Birthday to the Bull Market 🎉
Quarterly Webinar: Q4 2026 Market and Economic Themes
Medicare Open Enrollment 2026: What to Know
Subscribe to Our Blog
Chief Investment Officer | Managing Partner