U.S. stocks have performed exceptionally well over the past few years, with the S&P 500 returning about +21% annually over the last three years. History shows that returns of this magnitude are rare and typically occur during periods of strong economic expansion or technological innovation.
 Portfolios have benefited from the market’s strength, but it changes today’s starting point and forward expectations. Past data suggests that when returns are this high, the following years tend to be more modest. Looking ahead to 2026, several key factors will shape the market’s path, including corporate earnings, economic conditions, and developments in the artificial intelligence industry.
Figure 1 graphs the S&P 500’s trailing 3-year annualized return for each year from 1932 to 2025. Between 2023 and 2025, the S&P 500 produced an annualized return of +21%.
Five Main Points
The S&P 500 Delivered Strong Returns Over the Past Three Years
The S&P 500 has delivered annualized returns of +21% over the past three years, a level that has only been matched a few times in the last century. Previous examples include the recovery after the Great Depression, the post-war boom of the 1950s, the dot-com era of the late 1990s, and the rebound from the pandemic in 2020–2021. Market returns have been well above average, but the key question is what happens next.
Recent Market Strength May Signal Lower Future Returns
Historical data shows that strong three-year returns are often followed by periods of lower returns. When the S&P 500 has gained more than +20% annually over three years, like today, the next year’s return tends to be below average.
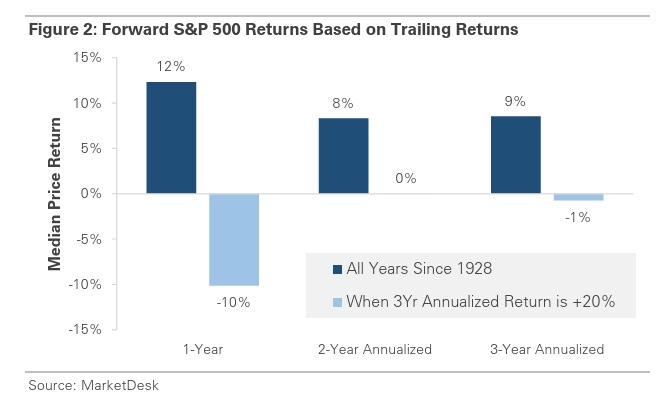 The pattern extends to the next two- and three-year periods, with the stock market trading flat and win rates declining. The market could still trade higher and extend the rally like it did in the late 1990s, but the data suggests a return to more average outcomes over time.
Figure 2 compares the S&P 500’s forward return when the trailing 3-year annualized return is >20% against all years. It shows periods of market strength are historically followed by weaker returns and lower win rates.
Corporate Earnings Strength Could Support Valuations
Corporate earnings have been strong recently, with S&P 500 companies growing earnings in each of the past eight quarters. Earnings have grown at a double-digit pace in four of the past five quarters, and analysts expect a year of double-digit growth in 2026. While stocks are expensive compared to historical standards, continued strong earnings growth could justify current valuations. If companies continue to deliver solid results, it may help the market grow into its expensive valuation and could extend the rally.
Economic Conditions Will Impact the Stock Market
A divide emerged in the economy in recent years. High interest rates have weighed on many traditional sectors of the economy, such as housing and manufacturing, while consumer spending and AI investment continue to support growth. The economy’s growth will impact the stock market. If the Federal Reserve’s rate cuts boost economic activity, it could extend the current rally. On the other hand, if rate-sensitive areas of the economy remain soft or AI-capex spending slows, it could create headwinds for the market.
AI Enthusiasm Remains a Major Market Driver
The emergence of the AI industry has become a major theme in both the economy and the stock market. Its growth has drawn comparisons to the dot-com era of the late 1990s. While there are clear differences, including today’s companies having stronger fundamentals, the comparison speaks to the excitement around AI as a technology. One path for the stock market to potentially trade high is continued momentum driven by investor enthusiasm. Another could be lasting gains through real improvements in productivity and profits. Whether driven by sentiment or fundamentals, AI remains central to how markets may trade in 2026.
Conclusion
After a rare three-year run of roughly +21% annualized returns, it’s reasonable to expect the market’s next stretch to look more like “normal” than exceptional. History suggests strong periods like this are often followed by more modest gains and a bumpier path, even if the market can still move higher in the near term. As we look toward 2026, the biggest swing factors will be whether earnings growth continues to validate today’s valuations, how the economy responds as rates evolve, and whether AI translates from investor excitement into durable productivity and profit gains.
Our job is to stay disciplined: keep portfolios aligned with long-term goals, manage risk thoughtfully, and avoid letting a great recent run lull us into unrealistic expectations.
Concerns or questions about how your investment portfolio will hold up in the current market environment? Contact Financial Synergies today.
We are a boutique, financial advisory and total wealth management firm with over 35 years helping clients navigate turbulent markets. To learn more about our approach to investment management please reach out to us. One of our seasoned advisors would be happy to help you build a custom financial plan to help ensure you accomplish your financial goals and objectives. Schedule a conversation with us today.
More relevant articles by Financial Synergies:
Blog Disclosures
This content, which contains security-related opinions and/or information, is provided for informational purposes only and should not be relied upon in any manner as professional advice, or an endorsement of any practices, products or services. There can be no guarantees or assurances that the views expressed here will be applicable for any particular facts or circumstances, and should not be relied upon in any manner. You should consult your own financial advisors as to legal, business, tax, and other related matters concerning any investment.
The commentary in this “post” (including any related blogs, videos, and social media) reflects the personal opinions, viewpoints, and analyses of the Financial Synergies Wealth Advisors, Inc. employees providing such comments, and should not be regarded as the views of Financial Synergies Wealth Advisors, Inc. or its respective affiliates or as a description of advisory services provided by Financial Synergies Wealth Advisors, Inc. or performance returns of any Financial Synergies Wealth Advisors, Inc. client.
Any opinions expressed herein do not constitute or imply endorsement, sponsorship, or recommendation by Financial Synergies Wealth Advisors, Inc. or its employees. The views reflected in the commentary are subject to change at any time without notice.
Nothing on this website constitutes investment or financial planning advice, performance data or any recommendation that any particular security, portfolio of securities, transaction or investment strategy is suitable for any specific person. It also should not be construed as an offer soliciting the purchase or sale of any security mentioned. Nor should it be construed as an offer to provide investment advisory services by Financial Synergies Wealth Advisors, Inc.
Any mention of a particular security and related performance data is not a recommendation to buy or sell that security. Financial Synergies Wealth Advisors, Inc. manages its clients’ accounts using a variety of investment techniques and strategies, which are not necessarily discussed in the commentary. Investments in securities involve the risk of loss. Past performance is no guarantee of future results.
Any charts provided here or on any related Financial Synergies Wealth Advisors, Inc. personnel content outlets are for informational purposes only, and should also not be relied upon when making any investment decision. Any indices referenced for comparison are unmanaged and cannot be invested into directly. As always please remember investing involves risk and possible loss of principal capital; please seek advice from a licensed professional. Any projections, estimates, forecasts, targets, prospects and/or opinions expressed in these materials are subject to change without notice and may differ or be contrary to opinions expressed by others. Information in charts have been obtained from third-party sources and data, and may include those from portfolio securities of funds managed by Financial Synergies Wealth Advisors, Inc. While taken from sources believed to be reliable, Financial Synergies Wealth Advisors, Inc. has not independently verified such information and makes no representations about the enduring accuracy of the information or its appropriateness for a given situation. All content speaks only as of the date indicated.
Financial Synergies Wealth Advisors, Inc. is a registered investment adviser. Advisory services are only offered to clients or prospective clients where Financial Synergies Wealth Advisors, Inc. and its representatives are properly licensed or exempt from licensure. Investments in securities involve the risk of loss. Past performance is no guarantee of future results.
See Full Disclosures Page Here
 Skip to content


What Could Drive the S&P 500 Higher After +20% Annualized Returns?
U.S. stocks have performed exceptionally well over the past few years, with the S&P 500 returning about +21% annually over the last three years. History shows that returns of this magnitude are rare and typically occur during periods of strong economic expansion or technological innovation.
Figure 1 graphs the S&P 500’s trailing 3-year annualized return for each year from 1932 to 2025. Between 2023 and 2025, the S&P 500 produced an annualized return of +21%.
Five Main Points
The S&P 500 Delivered Strong Returns Over the Past Three Years
The S&P 500 has delivered annualized returns of +21% over the past three years, a level that has only been matched a few times in the last century. Previous examples include the recovery after the Great Depression, the post-war boom of the 1950s, the dot-com era of the late 1990s, and the rebound from the pandemic in 2020–2021. Market returns have been well above average, but the key question is what happens next.
Recent Market Strength May Signal Lower Future Returns
Historical data shows that strong three-year returns are often followed by periods of lower returns. When the S&P 500 has gained more than +20% annually over three years, like today, the next year’s return tends to be below average.
Figure 2 compares the S&P 500’s forward return when the trailing 3-year annualized return is >20% against all years. It shows periods of market strength are historically followed by weaker returns and lower win rates.
Corporate Earnings Strength Could Support Valuations
Corporate earnings have been strong recently, with S&P 500 companies growing earnings in each of the past eight quarters. Earnings have grown at a double-digit pace in four of the past five quarters, and analysts expect a year of double-digit growth in 2026. While stocks are expensive compared to historical standards, continued strong earnings growth could justify current valuations. If companies continue to deliver solid results, it may help the market grow into its expensive valuation and could extend the rally.
Economic Conditions Will Impact the Stock Market
A divide emerged in the economy in recent years. High interest rates have weighed on many traditional sectors of the economy, such as housing and manufacturing, while consumer spending and AI investment continue to support growth. The economy’s growth will impact the stock market. If the Federal Reserve’s rate cuts boost economic activity, it could extend the current rally. On the other hand, if rate-sensitive areas of the economy remain soft or AI-capex spending slows, it could create headwinds for the market.
AI Enthusiasm Remains a Major Market Driver
The emergence of the AI industry has become a major theme in both the economy and the stock market. Its growth has drawn comparisons to the dot-com era of the late 1990s. While there are clear differences, including today’s companies having stronger fundamentals, the comparison speaks to the excitement around AI as a technology. One path for the stock market to potentially trade high is continued momentum driven by investor enthusiasm. Another could be lasting gains through real improvements in productivity and profits. Whether driven by sentiment or fundamentals, AI remains central to how markets may trade in 2026.
Conclusion
After a rare three-year run of roughly +21% annualized returns, it’s reasonable to expect the market’s next stretch to look more like “normal” than exceptional. History suggests strong periods like this are often followed by more modest gains and a bumpier path, even if the market can still move higher in the near term. As we look toward 2026, the biggest swing factors will be whether earnings growth continues to validate today’s valuations, how the economy responds as rates evolve, and whether AI translates from investor excitement into durable productivity and profit gains.
Our job is to stay disciplined: keep portfolios aligned with long-term goals, manage risk thoughtfully, and avoid letting a great recent run lull us into unrealistic expectations.
Concerns or questions about how your investment portfolio will hold up in the current market environment? Contact Financial Synergies today.
We are a boutique, financial advisory and total wealth management firm with over 35 years helping clients navigate turbulent markets. To learn more about our approach to investment management please reach out to us. One of our seasoned advisors would be happy to help you build a custom financial plan to help ensure you accomplish your financial goals and objectives. Schedule a conversation with us today.
More relevant articles by Financial Synergies:
Blog Disclosures
This content, which contains security-related opinions and/or information, is provided for informational purposes only and should not be relied upon in any manner as professional advice, or an endorsement of any practices, products or services. There can be no guarantees or assurances that the views expressed here will be applicable for any particular facts or circumstances, and should not be relied upon in any manner. You should consult your own financial advisors as to legal, business, tax, and other related matters concerning any investment.
The commentary in this “post” (including any related blogs, videos, and social media) reflects the personal opinions, viewpoints, and analyses of the Financial Synergies Wealth Advisors, Inc. employees providing such comments, and should not be regarded as the views of Financial Synergies Wealth Advisors, Inc. or its respective affiliates or as a description of advisory services provided by Financial Synergies Wealth Advisors, Inc. or performance returns of any Financial Synergies Wealth Advisors, Inc. client.
Any opinions expressed herein do not constitute or imply endorsement, sponsorship, or recommendation by Financial Synergies Wealth Advisors, Inc. or its employees. The views reflected in the commentary are subject to change at any time without notice.
Nothing on this website constitutes investment or financial planning advice, performance data or any recommendation that any particular security, portfolio of securities, transaction or investment strategy is suitable for any specific person. It also should not be construed as an offer soliciting the purchase or sale of any security mentioned. Nor should it be construed as an offer to provide investment advisory services by Financial Synergies Wealth Advisors, Inc.
Any mention of a particular security and related performance data is not a recommendation to buy or sell that security. Financial Synergies Wealth Advisors, Inc. manages its clients’ accounts using a variety of investment techniques and strategies, which are not necessarily discussed in the commentary. Investments in securities involve the risk of loss. Past performance is no guarantee of future results.
Any charts provided here or on any related Financial Synergies Wealth Advisors, Inc. personnel content outlets are for informational purposes only, and should also not be relied upon when making any investment decision. Any indices referenced for comparison are unmanaged and cannot be invested into directly. As always please remember investing involves risk and possible loss of principal capital; please seek advice from a licensed professional. Any projections, estimates, forecasts, targets, prospects and/or opinions expressed in these materials are subject to change without notice and may differ or be contrary to opinions expressed by others. Information in charts have been obtained from third-party sources and data, and may include those from portfolio securities of funds managed by Financial Synergies Wealth Advisors, Inc. While taken from sources believed to be reliable, Financial Synergies Wealth Advisors, Inc. has not independently verified such information and makes no representations about the enduring accuracy of the information or its appropriateness for a given situation. All content speaks only as of the date indicated.
Financial Synergies Wealth Advisors, Inc. is a registered investment adviser. Advisory services are only offered to clients or prospective clients where Financial Synergies Wealth Advisors, Inc. and its representatives are properly licensed or exempt from licensure. Investments in securities involve the risk of loss. Past performance is no guarantee of future results.
See Full Disclosures Page Here
Recent Posts
Happy Birthday to the Bull Market 🎉
Quarterly Webinar: Q4 2026 Market and Economic Themes
Medicare Open Enrollment 2026: What to Know
Subscribe to Our Blog
Chief Investment Officer | Managing Partner