Monthly Market Update: AI and Geopolitics Continue to Drive Markets
For your convenience, we’ve also provided a PDF copy of the Monthly Market Update: AI and Geopolitics Continue to Drive Markets.
Monthly Market Summary
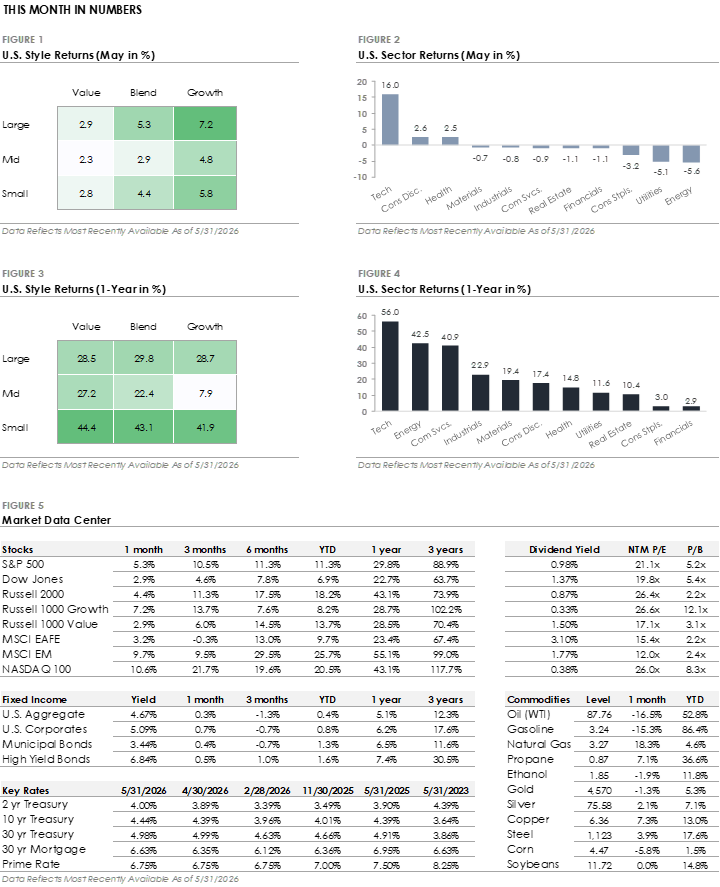
- The S&P 500 Index gained +5.3% in May and set multiple new all-time highs. Technology led all S&P 500 sectors with a +16.0% return, followed by Consumer Discretionary (+2.6%) and Health Care (+2.5%). However, eight of eleven sectors traded lower, led by Energy (-5.6%), Utilities (-5.1%), and Consumer Staples (-3.2%).
- Bonds traded higher despite a mid-month surge in Treasury yields. The U.S. Bond Aggregate returned +0.3% but underperformed corporate bonds as credit spreads tightened. Investment-grade and high-yield corporates returned +0.7% and +0.5%, respectively, with both outperforming the broader Bond Aggregate.
- International stock traded higher in May but were mixed. Emerging markets gained +9.7% and outperformed the S&P 500, while developed markets’ +3.2% return lagged both U.S stocks and emerging markets.
Stocks Set New Highs as Geopolitical Tensions Ease
May was a strong month for equities, with most major indexes setting fresh all-time highs. The S&P 500 and tech-heavy Nasdaq 100 set new highs each week, with the Dow Jones and Russell 2000 also setting new highs throughout the month. Even the equal-weight S&P 500, which gives each company the same weight regardless of market cap, set a new high. While the equal-weighted index’s move signals broadening participation, leadership was narrow within the index.
The technology sector gained +16% and was the only sector to outperform the S&P 500 Index. Eight of eleven S&P 500 sectors traded lower, and ten of eleven sectors underperformed the index. The concentration showed up in factor indexes as well, with large-cap growth returning +7.2% versus +2.9% for large-cap value. The performance gap highlights a notable trend this year: AI and tech stocks continue to outperform more traditional, cyclical companies.
Bonds also traded higher, with the U.S. Aggregate Bond Index returning +0.3% and corporate bonds outperforming as credit spreads tightened further. The bond market’s gains came despite a surge in interest rates mid-month. The 30-year Treasury yield spiked above 5%, reaching levels last seen in 2007, and the 10-year Treasury set a new 52-week high.
The trigger was back-to-back hot inflation reports for consumer and producer prices, with the Middle East conflict and elevated oil prices creating broader price pressures. Following the inflation reports, the market now places a greater than 50% probability of a Fed rate hike at the December 2026 meeting, a significant shift from earlier in the year when the market assumed a rate-cutting path. With Treasury yields at multi-decade highs and oil prices leading to inflation concerns, the bond market is shifting toward interest rates remaining higher for longer.
This Year’s Two Defining Themes: Geopolitics & Artificial Intelligence
Two themes have defined markets this year. The first is geopolitics. Trade and tariff uncertainty earlier in the year has given way to military conflict in the Middle East, which has created an oil supply disruption. The Strait of Hormuz, which carries roughly 20% of global oil supply, has been effectively closed since the conflict began in late February, causing global oil inventories to shrink. Oil prices remain elevated after briefly hitting four-year highs earlier this year but have been relatively contained given the extent of the oil supply disruption.
There was partial relief in May as U.S.-Iran negotiations progressed and the market began pricing in a potential reopening of the Strait. West Texas Intermediate crude ended the month below $90 per barrel, down -16.5%. However, the path forward remains uncertain, as a successful deal would take months to restore shipping traffic to pre-conflict levels. What happens next in the Middle East will impact energy prices, the inflation outlook, and the broader financial market.
The second theme is the artificial intelligence buildout. Companies have committed hundreds of billions to build the AI industry’s physical backbone, including data centers, computer chips, and power generation. Forecasted 2026 capital spending across the leading tech companies now exceeds $600 billion, with most of the capex directed at AI infrastructure. The spending is driving economic growth and starting to show up in corporate earnings, with AI-linked revenue growth becoming a significant driver of overall S&P 500 profit growth. The investment is also creating drastic changes. Shortages across parts of the technology supply chains are creating bottlenecks, and companies are experiencing rapid growth as they repurpose products and services for the age of AI. The pace of spending and technological change explains much of the performance gap between the tech sector and more traditional areas of the stock market.
Disclosures
The information and opinions provided herein are provided as general market commentary only and are subject to change at any time without notice. This commentary may contain forward-looking statements that are subject to various risks and uncertainties. None of the events or outcomes mentioned here may come to pass, and actual results may differ materially from those expressed or implied in these statements. No mention of a particular security, index, or other instrument in this report constitutes a recommendation to buy, sell, or hold that or any other security, nor does it constitute an opinion on the suitability of any security or index. The report is strictly an informational publication and has been prepared without regard to the particular investments and circumstances of the recipient.
Past performance does not guarantee or indicate future results. Any index performance mentioned is for illustrative purposes only and does not reflect any management fees, transaction costs, or expenses. Indexes are unmanaged, and one cannot invest directly in an index. Index performance does not represent the actual performance that would be achieved by investing in a fund.
Stock performance and fundamental data is based on the following instruments: SPDR S&P 500 ETF (SPY), SPDR Dow Jones ETF (DIA), iShares Russell 2000 ETF (IWM), iShares Russell 1000 Growth ETF (IWF), iShares Russell 1000 Value ETF (IWD), iShares MSCI EAFE ETF (EFA), iShares MSCI Emerging Markets ETF (EEM), Invesco QQQ Trust (QQQ).
Fixed Income performance is based on the following instruments: iShares Core U.S. Aggregate Bond ETF (AGG), iShares Investment Grade Corporate ETF (LQD), iShares National Muni Bond ETF (MUB), iShares High Yield Corporate ETF (HYG).
Fixed Income yields and key rates are based on the following instruments: Bloomberg US Aggregate, ICE BofA US Corporate, ICE BofA US Municipal Securities, ICE BofA US High Yield, 2 Year US Benchmark Bond, 10 Year US Benchmark Bond, 30 Year US Benchmark Bond, 30 Year US Fixed Mortgage Rate, US Prime Rate.
Commodity prices are based on the following instruments: Crude Oil WTI (NYM $/bbl), Gasoline Regular U.S. Gulf Coast ($/gal), Natural Gas (NYM $/mmbtu), Propane (NYM $/gal), Ethanol (CRB $/gallon), Gold (NYM $/ozt), Silver (NYM $/ozt), Copper NYMEX ($/lb), U.S. Midwest Domestic Hot-Rolled Coil Steel (NYM $/st), Corn (CBT $/bu), Soybeans (Chicago $/bu).
U.S. Style performance is based on the following instruments: iShares Russell 1000 Value ETF (IWD), SPDR S&P 500 ETF Trust (SPY), iShares Russell 1000 Growth ETF (IWF), iShares Russell Mid-Cap Value ETF (IWS), iShares Russell Midcap ETF (IWR), iShares Russell Mid-Cap Growth ETF (IWP), iShares Russell 2000 Value ETF (IWN), iShares Russell 2000 ETF (IWM), iShares Russell 2000 Growth ETF (IWO).
U.S. Sector performance is based on the following instruments: Consumer Discretionary Sector SPDR ETF (XLY), Consumer Staples Sector SPDR ETF (XLP), Energy Sector SPDR ETF (XLE), Financial Sector SPDR ETF (XLF), Health Care Sector SPDR ETF (XLV), Industrial Sector SPDR ETF (XLI), Materials Sector SPDR ETF (XLB), Technology Sector SPDR ETF (XLK), Communication Services Sector SPDR ETF (XLC), Utilities Sector SPDR ETF (XLU), Real Estate Sector SPDR ETF (XLRE).
Concerns or questions about how your investment portfolio will hold up in the current market environment? Contact Financial Synergies today.
We are a boutique, financial advisory and total wealth management firm with over 35 years helping clients navigate turbulent markets. To learn more about our approach to investment management please reach out to us. One of our seasoned advisors would be happy to help you build a custom financial plan to help ensure you accomplish your financial goals and objectives. Schedule a conversation with us today.
More relevant articles by Financial Synergies:
Blog Disclosures
This content, which contains security-related opinions and/or information, is provided for informational purposes only and should not be relied upon in any manner as professional advice, or an endorsement of any practices, products or services. There can be no guarantees or assurances that the views expressed here will be applicable for any particular facts or circumstances, and should not be relied upon in any manner. You should consult your own financial advisors as to legal, business, tax, and other related matters concerning any investment.
The commentary in this “post” (including any related blogs, videos, and social media) reflects the personal opinions, viewpoints, and analyses of the Financial Synergies Wealth Advisors, Inc. employees providing such comments, and should not be regarded as the views of Financial Synergies Wealth Advisors, Inc. or its respective affiliates or as a description of advisory services provided by Financial Synergies Wealth Advisors, Inc. or performance returns of any Financial Synergies Wealth Advisors, Inc. client.
Any opinions expressed herein do not constitute or imply endorsement, sponsorship, or recommendation by Financial Synergies Wealth Advisors, Inc. or its employees. The views reflected in the commentary are subject to change at any time without notice.
Nothing on this website constitutes investment or financial planning advice, performance data or any recommendation that any particular security, portfolio of securities, transaction or investment strategy is suitable for any specific person. It also should not be construed as an offer soliciting the purchase or sale of any security mentioned. Nor should it be construed as an offer to provide investment advisory services by Financial Synergies Wealth Advisors, Inc.
Any mention of a particular security and related performance data is not a recommendation to buy or sell that security. Financial Synergies Wealth Advisors, Inc. manages its clients’ accounts using a variety of investment techniques and strategies, which are not necessarily discussed in the commentary. Investments in securities involve the risk of loss. Past performance is no guarantee of future results.
Any charts provided here or on any related Financial Synergies Wealth Advisors, Inc. personnel content outlets are for informational purposes only, and should also not be relied upon when making any investment decision. Any indices referenced for comparison are unmanaged and cannot be invested into directly. As always please remember investing involves risk and possible loss of principal capital; please seek advice from a licensed professional. Any projections, estimates, forecasts, targets, prospects and/or opinions expressed in these materials are subject to change without notice and may differ or be contrary to opinions expressed by others. Information in charts have been obtained from third-party sources and data, and may include those from portfolio securities of funds managed by Financial Synergies Wealth Advisors, Inc. While taken from sources believed to be reliable, Financial Synergies Wealth Advisors, Inc. has not independently verified such information and makes no representations about the enduring accuracy of the information or its appropriateness for a given situation. All content speaks only as of the date indicated.
Financial Synergies Wealth Advisors, Inc. is a registered investment adviser. Advisory services are only offered to clients or prospective clients where Financial Synergies Wealth Advisors, Inc. and its representatives are properly licensed or exempt from licensure. Investments in securities involve the risk of loss. Past performance is no guarantee of future results.
See Full Disclosures Page Here
 Skip to content


Monthly Market Update: AI and Geopolitics Continue to Drive Markets
Monthly Market Update: AI and Geopolitics Continue to Drive Markets
For your convenience, we’ve also provided a PDF copy of the Monthly Market Update: AI and Geopolitics Continue to Drive Markets.
Monthly Market Summary
Stocks Set New Highs as Geopolitical Tensions Ease
May was a strong month for equities, with most major indexes setting fresh all-time highs. The S&P 500 and tech-heavy Nasdaq 100 set new highs each week, with the Dow Jones and Russell 2000 also setting new highs throughout the month. Even the equal-weight S&P 500, which gives each company the same weight regardless of market cap, set a new high. While the equal-weighted index’s move signals broadening participation, leadership was narrow within the index.
The technology sector gained +16% and was the only sector to outperform the S&P 500 Index. Eight of eleven S&P 500 sectors traded lower, and ten of eleven sectors underperformed the index. The concentration showed up in factor indexes as well, with large-cap growth returning +7.2% versus +2.9% for large-cap value. The performance gap highlights a notable trend this year: AI and tech stocks continue to outperform more traditional, cyclical companies.
Bonds also traded higher, with the U.S. Aggregate Bond Index returning +0.3% and corporate bonds outperforming as credit spreads tightened further. The bond market’s gains came despite a surge in interest rates mid-month. The 30-year Treasury yield spiked above 5%, reaching levels last seen in 2007, and the 10-year Treasury set a new 52-week high.
The trigger was back-to-back hot inflation reports for consumer and producer prices, with the Middle East conflict and elevated oil prices creating broader price pressures. Following the inflation reports, the market now places a greater than 50% probability of a Fed rate hike at the December 2026 meeting, a significant shift from earlier in the year when the market assumed a rate-cutting path. With Treasury yields at multi-decade highs and oil prices leading to inflation concerns, the bond market is shifting toward interest rates remaining higher for longer.
This Year’s Two Defining Themes: Geopolitics & Artificial Intelligence
Two themes have defined markets this year. The first is geopolitics. Trade and tariff uncertainty earlier in the year has given way to military conflict in the Middle East, which has created an oil supply disruption. The Strait of Hormuz, which carries roughly 20% of global oil supply, has been effectively closed since the conflict began in late February, causing global oil inventories to shrink. Oil prices remain elevated after briefly hitting four-year highs earlier this year but have been relatively contained given the extent of the oil supply disruption.
There was partial relief in May as U.S.-Iran negotiations progressed and the market began pricing in a potential reopening of the Strait. West Texas Intermediate crude ended the month below $90 per barrel, down -16.5%. However, the path forward remains uncertain, as a successful deal would take months to restore shipping traffic to pre-conflict levels. What happens next in the Middle East will impact energy prices, the inflation outlook, and the broader financial market.
The second theme is the artificial intelligence buildout. Companies have committed hundreds of billions to build the AI industry’s physical backbone, including data centers, computer chips, and power generation. Forecasted 2026 capital spending across the leading tech companies now exceeds $600 billion, with most of the capex directed at AI infrastructure. The spending is driving economic growth and starting to show up in corporate earnings, with AI-linked revenue growth becoming a significant driver of overall S&P 500 profit growth. The investment is also creating drastic changes. Shortages across parts of the technology supply chains are creating bottlenecks, and companies are experiencing rapid growth as they repurpose products and services for the age of AI. The pace of spending and technological change explains much of the performance gap between the tech sector and more traditional areas of the stock market.
Disclosures
The information and opinions provided herein are provided as general market commentary only and are subject to change at any time without notice. This commentary may contain forward-looking statements that are subject to various risks and uncertainties. None of the events or outcomes mentioned here may come to pass, and actual results may differ materially from those expressed or implied in these statements. No mention of a particular security, index, or other instrument in this report constitutes a recommendation to buy, sell, or hold that or any other security, nor does it constitute an opinion on the suitability of any security or index. The report is strictly an informational publication and has been prepared without regard to the particular investments and circumstances of the recipient.
Past performance does not guarantee or indicate future results. Any index performance mentioned is for illustrative purposes only and does not reflect any management fees, transaction costs, or expenses. Indexes are unmanaged, and one cannot invest directly in an index. Index performance does not represent the actual performance that would be achieved by investing in a fund.
Stock performance and fundamental data is based on the following instruments: SPDR S&P 500 ETF (SPY), SPDR Dow Jones ETF (DIA), iShares Russell 2000 ETF (IWM), iShares Russell 1000 Growth ETF (IWF), iShares Russell 1000 Value ETF (IWD), iShares MSCI EAFE ETF (EFA), iShares MSCI Emerging Markets ETF (EEM), Invesco QQQ Trust (QQQ).
Fixed Income performance is based on the following instruments: iShares Core U.S. Aggregate Bond ETF (AGG), iShares Investment Grade Corporate ETF (LQD), iShares National Muni Bond ETF (MUB), iShares High Yield Corporate ETF (HYG).
Fixed Income yields and key rates are based on the following instruments: Bloomberg US Aggregate, ICE BofA US Corporate, ICE BofA US Municipal Securities, ICE BofA US High Yield, 2 Year US Benchmark Bond, 10 Year US Benchmark Bond, 30 Year US Benchmark Bond, 30 Year US Fixed Mortgage Rate, US Prime Rate.
Commodity prices are based on the following instruments: Crude Oil WTI (NYM $/bbl), Gasoline Regular U.S. Gulf Coast ($/gal), Natural Gas (NYM $/mmbtu), Propane (NYM $/gal), Ethanol (CRB $/gallon), Gold (NYM $/ozt), Silver (NYM $/ozt), Copper NYMEX ($/lb), U.S. Midwest Domestic Hot-Rolled Coil Steel (NYM $/st), Corn (CBT $/bu), Soybeans (Chicago $/bu).
U.S. Style performance is based on the following instruments: iShares Russell 1000 Value ETF (IWD), SPDR S&P 500 ETF Trust (SPY), iShares Russell 1000 Growth ETF (IWF), iShares Russell Mid-Cap Value ETF (IWS), iShares Russell Midcap ETF (IWR), iShares Russell Mid-Cap Growth ETF (IWP), iShares Russell 2000 Value ETF (IWN), iShares Russell 2000 ETF (IWM), iShares Russell 2000 Growth ETF (IWO).
U.S. Sector performance is based on the following instruments: Consumer Discretionary Sector SPDR ETF (XLY), Consumer Staples Sector SPDR ETF (XLP), Energy Sector SPDR ETF (XLE), Financial Sector SPDR ETF (XLF), Health Care Sector SPDR ETF (XLV), Industrial Sector SPDR ETF (XLI), Materials Sector SPDR ETF (XLB), Technology Sector SPDR ETF (XLK), Communication Services Sector SPDR ETF (XLC), Utilities Sector SPDR ETF (XLU), Real Estate Sector SPDR ETF (XLRE).
Concerns or questions about how your investment portfolio will hold up in the current market environment? Contact Financial Synergies today.
We are a boutique, financial advisory and total wealth management firm with over 35 years helping clients navigate turbulent markets. To learn more about our approach to investment management please reach out to us. One of our seasoned advisors would be happy to help you build a custom financial plan to help ensure you accomplish your financial goals and objectives. Schedule a conversation with us today.
More relevant articles by Financial Synergies:
Blog Disclosures
This content, which contains security-related opinions and/or information, is provided for informational purposes only and should not be relied upon in any manner as professional advice, or an endorsement of any practices, products or services. There can be no guarantees or assurances that the views expressed here will be applicable for any particular facts or circumstances, and should not be relied upon in any manner. You should consult your own financial advisors as to legal, business, tax, and other related matters concerning any investment.
The commentary in this “post” (including any related blogs, videos, and social media) reflects the personal opinions, viewpoints, and analyses of the Financial Synergies Wealth Advisors, Inc. employees providing such comments, and should not be regarded as the views of Financial Synergies Wealth Advisors, Inc. or its respective affiliates or as a description of advisory services provided by Financial Synergies Wealth Advisors, Inc. or performance returns of any Financial Synergies Wealth Advisors, Inc. client.
Any opinions expressed herein do not constitute or imply endorsement, sponsorship, or recommendation by Financial Synergies Wealth Advisors, Inc. or its employees. The views reflected in the commentary are subject to change at any time without notice.
Nothing on this website constitutes investment or financial planning advice, performance data or any recommendation that any particular security, portfolio of securities, transaction or investment strategy is suitable for any specific person. It also should not be construed as an offer soliciting the purchase or sale of any security mentioned. Nor should it be construed as an offer to provide investment advisory services by Financial Synergies Wealth Advisors, Inc.
Any mention of a particular security and related performance data is not a recommendation to buy or sell that security. Financial Synergies Wealth Advisors, Inc. manages its clients’ accounts using a variety of investment techniques and strategies, which are not necessarily discussed in the commentary. Investments in securities involve the risk of loss. Past performance is no guarantee of future results.
Any charts provided here or on any related Financial Synergies Wealth Advisors, Inc. personnel content outlets are for informational purposes only, and should also not be relied upon when making any investment decision. Any indices referenced for comparison are unmanaged and cannot be invested into directly. As always please remember investing involves risk and possible loss of principal capital; please seek advice from a licensed professional. Any projections, estimates, forecasts, targets, prospects and/or opinions expressed in these materials are subject to change without notice and may differ or be contrary to opinions expressed by others. Information in charts have been obtained from third-party sources and data, and may include those from portfolio securities of funds managed by Financial Synergies Wealth Advisors, Inc. While taken from sources believed to be reliable, Financial Synergies Wealth Advisors, Inc. has not independently verified such information and makes no representations about the enduring accuracy of the information or its appropriateness for a given situation. All content speaks only as of the date indicated.
Financial Synergies Wealth Advisors, Inc. is a registered investment adviser. Advisory services are only offered to clients or prospective clients where Financial Synergies Wealth Advisors, Inc. and its representatives are properly licensed or exempt from licensure. Investments in securities involve the risk of loss. Past performance is no guarantee of future results.
See Full Disclosures Page Here
Recent Posts
Retirement Income Risks: Planning for a Longer Life
What 7% Mortgages Mean for Housing and the Economy
Financial Synergies Named One of the Fastest Growing Private Companies in Houston
Subscribe to Our Blog
Chief Investment Officer | Managing Partner