Private credit has become a meaningful part of how we build portfolios for many of our clients. For those who already have an allocation, we want to take you behind the scenes and explain, in plain language, what’s actually happening in that sleeve of your portfolio and why we believe in it. For those who don’t yet own it, consider this an introduction to one of the most important shifts in finance over the past two decades, and a window into how we think about where it may — or may not — fit.
The broader story is worth understanding regardless of whether you currently own the asset class. Over the past two decades, a growing share of corporate lending has moved out of the banking system and into the hands of private investors — creating a meaningful, durable source of income and diversification for portfolios that can accommodate it. The key qualifier is that last phrase. Private credit isn’t appropriate for every client, and the right allocation depends on each investor’s liquidity needs, time horizon, and overall plan. Where it fits, we believe it earns its place. Where it doesn’t, we don’t force it.
Private Credit and Direct Lending, Explained
The private credit segment we’ll focus on here, and the one most clients own, is direct lending. The simplest way to think about it is “farm-to-table” finance. A direct lending manager raises capital from investors and lends it straight to a borrower — typically a mid-sized or upper-middle-market company — with no bank or syndication desk in the middle. The investor and the borrower meet directly through a single intermediary: the manager.
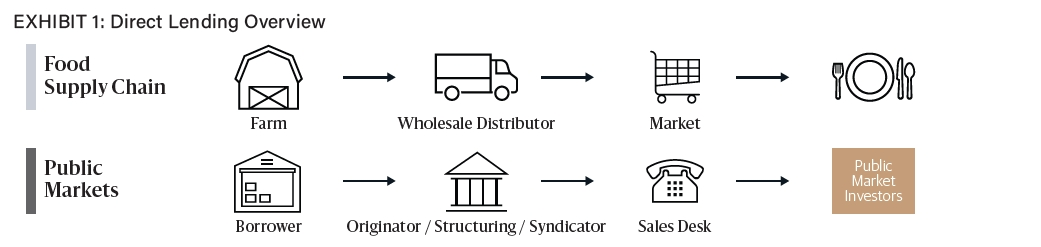
Most of these loans go to private-equity-owned businesses. A sponsor needs financing to acquire a company, refinance existing debt, or fund growth, and rather than tapping the syndicated loan market or issuing high-yield bonds, they call a direct lender. The reasons borrowers choose this path are practical: speed, certainty of execution, confidentiality, and a customized structure they can negotiate with one counterparty rather than dozens.
The market exists at the scale it does today because of forces set in motion by the 2008 financial crisis. As banks pulled back from middle-market lending under tighter capital rules, non-bank lenders stepped in to fill the void.

Private corporate credit assets under management grew from roughly $0.9 trillion in 2005 to $4.0 trillion in 2025, and its share of the below-investment-grade credit market expanded from 8% to 27% over that period (Blackstone, as of December 31, 2025). Within leveraged buyout financing specifically, private credit’s share jumped from 65% in 2020 to 84% in 2025 (Pitchbook LCD). What was once a niche corner of the credit markets has become the dominant way mid-sized American companies get financed.
Why the Yield in Private Credit is Higher
When you look at the income generated by direct lending, the math comes from three pieces stacked together:
- A Floating Base Rate: Typically SOFR, the Secured Overnight Financing Rate.
- A Credit Spread: Additional interest charged above the base rate, determined by factors like the borrower’s creditworthiness, market conditions, and the specific loan terms.
- Origination or Deal Fees: Fees associated with structuring and executing the loan, which contribute to income.
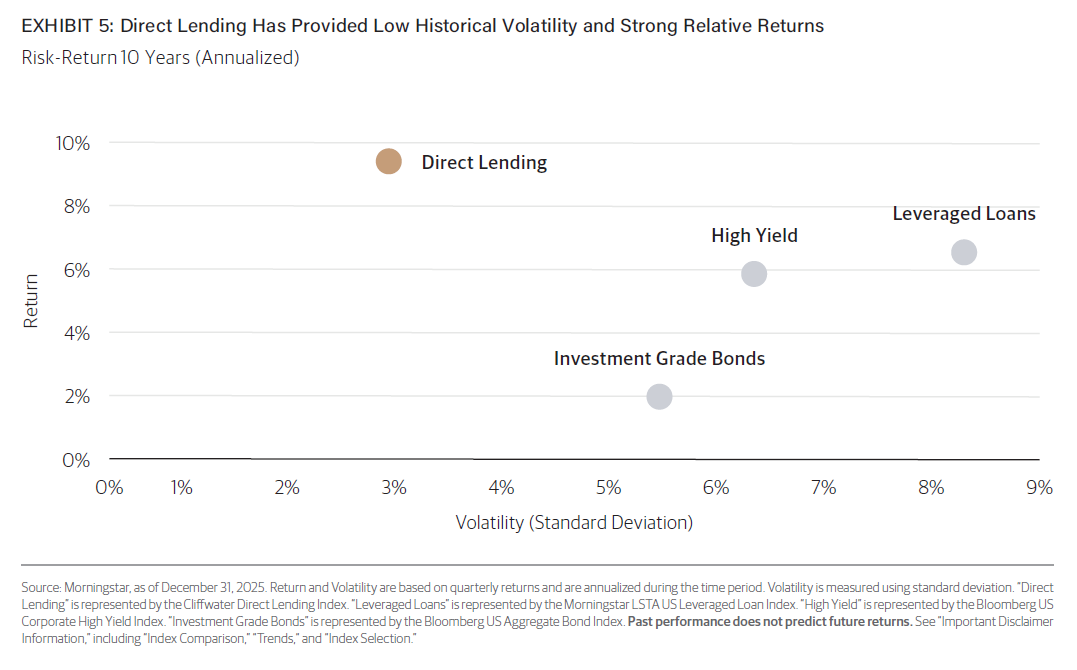
Stack those together and you get income that has historically run about 200 basis points — two full percentage points — above broadly syndicated leveraged loans (J.P. Morgan Research, December 2025).
Why are borrowers willing to pay that premium? Because what they’re buying isn’t just capital — it’s certainty, speed, and a tailored structure. In a public-market debt deal, a borrower may face weeks of marketing, a price that floats with sentiment, and the possibility of a deal pulled if conditions sour. A direct lender can commit at scale in days, with terms that don’t move. For a private equity sponsor trying to close an acquisition, that reliability has real value.
The 200 basis points isn’t a free lunch; it’s the price of execution and customization, and it compounds. An investor who put $10,000 into direct lending ten years ago would have earned roughly 1.4 times the income of the same dollars in leveraged loans over that period (Cliffwater Direct Lending Index, as of December 31, 2025).
Why it’s Defensive, not just Yield-y
It would be a mistake, though, to think of direct lending as simply a higher-yielding version of a bond fund. The structural features of these loans are what give us conviction — they’re built to defend principal, not just to harvest income.
Three features matter most.
First, these loans are senior secured, meaning they sit at the top of the borrower’s capital structure with first claim on assets in a stress scenario. The borrower’s equity owners and junior debt holders absorb losses before the loans take a dollar of impairment.
Second, they’re floating rate, so when short-term rates rise, the income on the loan rises with them, which is why direct lending held up so well during the 2022 bond drawdown that hit traditional fixed income hard.
Third, and perhaps most importantly, the underwriting today is far more conservative than in past credit cycles. The average loan-to-value on direct lending deals is roughly 42%, compared with about 65% before the Global Financial Crisis and as high as 90% in the late 1990s (PitchBook LCD; KBRA DLD).
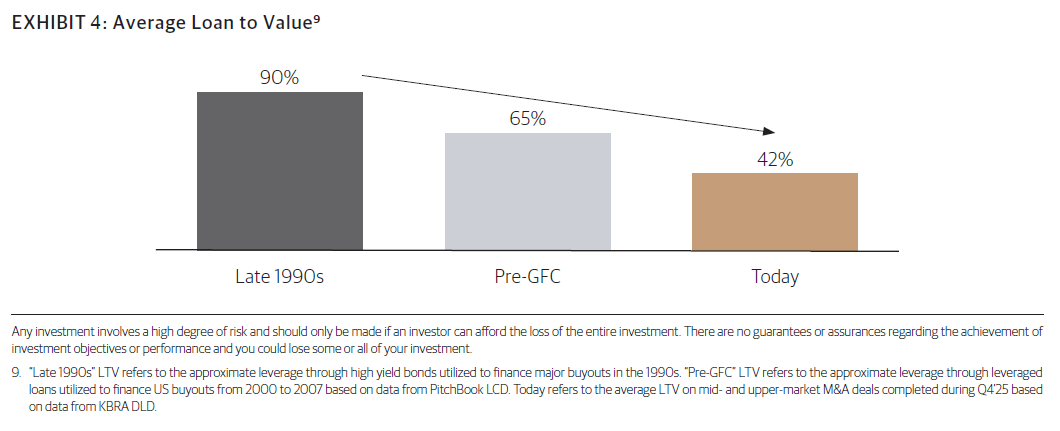
A useful analogy: think of a home mortgage where the bank lent only 42% of the home’s value. The homeowner would have to lose nearly 60% of their equity before the bank’s loan was even at risk. That’s the kind of equity cushion sitting beneath today’s direct lending portfolios.
The track record bears this out. Over the past 20 years, the S&P 500 has finished in negative territory three times — 2008, 2018, and 2022. In all three of those years, direct lending outperformed both stocks and leveraged loans, and in two of them (2018 and 2022) it generated positive returns while equities posted meaningful drawdowns (Cliffwater Direct Lending Index; Morningstar). None of this means private credit is risk-free. Defaults happen, and managers who underwrite poorly will see losses. But the structural defenses are real, and they’ve held up across cycles.
How it Fits in a Portfolio
Here we want to be careful about framing. Direct lending is not a replacement for traditional bonds. Treasuries and high-grade corporate bonds still play essential roles in a portfolio. They provide deep liquidity, true safe-haven characteristics in equity sell-offs, and the duration exposure that benefits from falling rates. We continue to believe a well-built bond allocation is foundational, and nothing about our private credit thesis changes that.
What direct lending does is sit alongside that bond allocation as a complement — adding income, reducing overall portfolio volatility, and diversifying the drivers of return. The intuition is straightforward: direct lending earns its return from credit spreads and floating short rates rather than from duration, so it tends to behave differently from traditional bonds in the same environment. When rates rise sharply, a bond fund’s price falls; a floating-rate loan portfolio’s income goes up.
An illustration commonly cited in industry research compares a traditional 60/40 stock-bond portfolio with a 60/20/20 portfolio that carves 20% out of the fixed income sleeve and allocates it to direct lending. Over the ten years ending December 31, 2025, that adjustment historically delivered higher annualized returns (10.7% vs. 9.8%), lower volatility (9.5% vs. 10.3%), and a meaningfully higher current yield (4.1% vs. 2.8%) (Bloomberg, Morningstar, Cliffwater).
Past results don’t predict the future, of course, and these are index figures that don’t reflect fund-level fees. But the directional story — better income, lower volatility, broader diversification — is consistent with how we think about the role this sleeve plays in client portfolios.
How Clients Access Private Credit Through Our Portfolios
For most clients, the practical question is: how do I actually own this? Direct lending was historically the province of institutions investing through long-lock-up drawdown funds, with capital calls, distributions, and ten-year commitments. That structure works for pensions and endowments but is poorly suited for individual investors.
The vehicles we use for client portfolios are different. We allocate primarily through semi-liquid, evergreen fund structures — interval funds and perpetual non-traded BDCs (business development companies), with Blackstone’s BCRED serving as one representative example of the category. These funds offer monthly subscriptions, quarterly redemption windows (typically capped at 5% of fund assets per quarter), and continuous deployment of capital, which together make them dramatically more accessible than the traditional drawdown model.
We want to be candid about the tradeoff. These are not daily-liquid like a bond mutual fund. Redemptions are subject to caps and gates that can be triggered in stressed conditions, and the funds are designed for investors who can leave capital invested for multiple years. That illiquidity is real, and in our view, it’s also part of what generates the excess return. The premium investors earn on direct lending is, in part, compensation for accepting limits on daily liquidity. Used appropriately and sized within a client’s broader liquidity plan, we think it’s a tradeoff that has historically paid off.
What We’re Watching
We hold our conviction with both eyes open. Three things keep our attention.
The first is default risk in a slowing economy. Direct lending portfolios are concentrated in leveraged middle-market companies, and if growth weakens materially, defaults will rise. Manager underwriting quality matters far more in that environment than it does in benign conditions. The second is manager dispersion. Returns across direct lending funds vary widely — far more than across, say, large-cap stock funds — and the gap between top and bottom managers can be several hundred basis points a year. Where you invest, and who you invest with, matters enormously. The third is scale and sponsor relationships. The best direct lenders see the most deal flow, can be selective in what they underwrite, and have the balance sheet to commit at the size sponsors need. We deliberately work with established, large-scale institutional managers rather than chasing yield with smaller, newer, or higher-risk vehicles.
Closing
We believe direct lending earns its place in client portfolios, not as a bond replacement, but as an additive complement that improves income, dampens volatility, and broadens the engines of return. The combination of senior secured positioning, floating-rate income, conservative loan-to-values, and the underlying growth of private corporate credit gives us confidence that this is a durable, multi-year opportunity, not a yield fad.
It’s also one piece of a broader private markets framework we use across client portfolios — alongside private equity, private real estate, and private infrastructure — each playing a distinct role. Private credit is the income-and-stability piece. We’ll continue to share our thinking on the others in future articles.
A Truly Unique Wealth Management Experience
Let’s create a financial plan and investment strategy that allows you to live the life of your dreams. Schedule your free consultation today to explore tailored financial strategies designed to secure your future!
Are We Right for You?
Concerns or questions about how your investment portfolio will hold up in the current market environment? Contact Financial Synergies today.
We are a boutique, financial advisory and total wealth management firm with over 35 years helping clients navigate turbulent markets. To learn more about our approach to investment management please reach out to us. One of our seasoned advisors would be happy to help you build a custom financial plan to help ensure you accomplish your financial goals and objectives. Schedule a conversation with us today.
More relevant articles by Financial Synergies:
Footnotes
¹ Private corporate credit assets under management and market share figures sourced from Bloomberg (“High Yield”), LCD (“Senior Loans”), and Preqin (“Private Credit”), as of December 31, 2025, as referenced in Blackstone, Essentials of Private Credit: Direct Lending (Blackstone University, 2025). Total addressable US sub-investment grade credit market defined as the aggregate of US high yield bonds, US leveraged loans, and North American private credit markets. Preqin private credit data as of June 30, 2025, the latest available.
² Private credit share of leveraged buyout (LBO) transaction activity based on count, sourced from PitchBook LCD as of December 31, 2025.
³ Yield premium of approximately 200 basis points represents the historical spread of direct lending over broadly syndicated leveraged loans. Source: J.P. Morgan Research, as of December 2025.
⁴ Income return comparison reflects the growth of $10,000 invested over the ten-year period ending December 31, 2025. Direct lending represented by the Cliffwater Direct Lending Index; leveraged loans represented by the Morningstar LSTA US B Ratings Loans Index. Source: Morningstar, Cliffwater. Past performance does not predict future returns.
⁵ Average loan-to-value (LTV) figures: “Late 1990s” reflects approximate leverage through high yield bonds used to finance major buyouts in the 1990s; “Pre-GFC” reflects approximate leverage through leveraged loans used to finance US buyouts from 2000 to 2007 (source: PitchBook LCD); “Today” reflects the average LTV on mid- and upper-market M&A deals completed during Q4 2025 (source: KBRA DLD).
⁶ Annual return comparisons for 2008, 2018, and 2022 sourced from Morningstar Direct, as of December 31, 2025. S&P 500 represented by the S&P 500 Index; leveraged loans by the Morningstar LSTA US Leveraged Loan Index; direct lending by the Cliffwater Direct Lending Index. The Cliffwater Direct Lending Index has an inception date of October 2015; pre-2016 direct lending figures are based on data from index constituents and predecessor methodologies as reported by Cliffwater.
⁷ Portfolio illustration compares a traditional 60/40 portfolio (60% S&P 500 Index / 40% Bloomberg US Aggregate Bond Index) to a 60/20/20 portfolio (60% S&P 500 / 20% Bloomberg US Aggregate / 20% Cliffwater Direct Lending Index) over the ten-year period from January 2016 to December 2025. Annualized returns and volatility calculated based on quarterly returns. Yield calculated using the annualized S&P 500 dividend yield, annualized Bloomberg US Aggregate Bond yield, and annual Cliffwater Direct Lending Index income return. Source: Bloomberg, Morningstar, Cliffwater. The figures shown are based on unmanaged index data, do not reflect fees or expenses that would be borne by an investor in any actual fund or strategy, and do not represent the performance of any Financial Synergies portfolio. Past performance does not predict future returns.
⁸ Business Development Companies (BDCs) are a type of closed-end investment vehicle established under the Investment Company Act of 1940 that invest primarily in privately held middle-market companies. Non-traded BDCs are not listed on a public exchange and typically offer periodic liquidity through quarterly share repurchase programs, generally capped at a percentage of fund assets (often approximately 5% per quarter). Such repurchase programs may be modified, suspended, or terminated by the fund’s board.
⁹ Reference to Blackstone Private Credit Fund (BCRED) is illustrative of the perpetual non-traded BDC fund category only and is not a recommendation, endorsement, or solicitation. Financial Synergies evaluates and selects private credit vehicles based on a range of factors including manager scale, underwriting discipline, sponsor relationships, fee structure, and fit within client portfolios. Specific funds used in client portfolios may differ.
Disclosure
This article is provided for educational and informational purposes only and does not constitute investment, legal, tax, or accounting advice. The views expressed are those of Financial Synergies Wealth Advisors as of the date of publication and are subject to change without notice. Nothing herein should be construed as an offer to sell, or a solicitation of an offer to buy, any security or investment product.
Past performance is not indicative of future results. Any references to historical returns, index data, or hypothetical portfolio illustrations (including comparisons between direct lending, leveraged loans, high yield bonds, investment grade bonds, and traditional 60/40 portfolio allocations) are presented for illustrative purposes only and reflect specific methodologies, time periods, and assumptions that may not be representative of future market conditions. Index comparisons have inherent limitations: the indices referenced — including the Cliffwater Direct Lending Index, the Morningstar LSTA US Leveraged Loan Index, the Bloomberg US Corporate High Yield Index, the Bloomberg US Aggregate Bond Index, and the S&P 500 Index — are unmanaged, do not reflect the deduction of fees or expenses, and may differ materially in composition, risk profile, and liquidity from any fund or strategy in which a client may invest.
Investments in private credit involve risk and are suitable only for eligible investors. Private credit investments are illiquid, have limited or no secondary market, may involve significant fees and expenses, and typically require medium- to long-term holding periods. Even evergreen and semi-liquid fund structures — including interval funds and perpetual non-traded business development companies (BDCs) — impose restrictions on redemptions, including periodic liquidity windows, redemption gates (typically capped as a percentage of fund assets per quarter), and the possibility that redemption requests may be limited, prorated, or suspended during periods of market stress. Direct lending investments are subject to credit risk, default risk, interest rate risk, and the risk that floating-rate income may decline if benchmark rates fall. Loan valuations are typically performed periodically and may not reflect realizable values. The senior secured nature of direct lending loans, lower loan-to-value ratios, and other structural protections referenced in this article seek to mitigate risk but do not eliminate it and do not protect against losses. There can be no assurance that any private credit strategy will achieve its objectives or avoid losses.
Diversification does not ensure a profit or protect against loss in declining markets. Manager selection is a critical component of private credit investing given the wide dispersion of returns among managers, and there can be no assurance that any selected manager will achieve results comparable to historical industry averages or to the indices referenced herein. References to specific funds or sponsors, including Blackstone’s BCRED, are illustrative of fund structure and category only and do not constitute a recommendation, endorsement, or solicitation with respect to any particular investment.
Private credit investments are generally available only to accredited investors and qualified purchasers as defined under federal securities laws. The suitability of any investment depends on each client’s individual financial circumstances, liquidity needs, time horizon, and goals. Clients should consult with their advisor before making any investment decision.
Financial Synergies Wealth Advisors is an SEC-registered investment adviser. Registration does not imply any particular level of skill or training. Additional information about our firm, including our investment strategies, fees, and potential conflicts of interest, is available in our Form ADV Part 2A, which is available upon request or at adviserinfo.sec.gov.
Certain data referenced in this article has been obtained from third-party sources believed to be reliable, including Blackstone, Cliffwater, Morningstar, Bloomberg, J.P. Morgan Research, PitchBook LCD, KBRA DLD, and Preqin. Financial Synergies has not independently verified this information and makes no representation as to its accuracy or completeness.
 Skip to content


Behind the Yield: Why We’re Allocating to Private Credit
Private credit has become a meaningful part of how we build portfolios for many of our clients. For those who already have an allocation, we want to take you behind the scenes and explain, in plain language, what’s actually happening in that sleeve of your portfolio and why we believe in it. For those who don’t yet own it, consider this an introduction to one of the most important shifts in finance over the past two decades, and a window into how we think about where it may — or may not — fit.
The broader story is worth understanding regardless of whether you currently own the asset class. Over the past two decades, a growing share of corporate lending has moved out of the banking system and into the hands of private investors — creating a meaningful, durable source of income and diversification for portfolios that can accommodate it. The key qualifier is that last phrase. Private credit isn’t appropriate for every client, and the right allocation depends on each investor’s liquidity needs, time horizon, and overall plan. Where it fits, we believe it earns its place. Where it doesn’t, we don’t force it.
Private Credit and Direct Lending, Explained
The private credit segment we’ll focus on here, and the one most clients own, is direct lending. The simplest way to think about it is “farm-to-table” finance. A direct lending manager raises capital from investors and lends it straight to a borrower — typically a mid-sized or upper-middle-market company — with no bank or syndication desk in the middle. The investor and the borrower meet directly through a single intermediary: the manager.
Most of these loans go to private-equity-owned businesses. A sponsor needs financing to acquire a company, refinance existing debt, or fund growth, and rather than tapping the syndicated loan market or issuing high-yield bonds, they call a direct lender. The reasons borrowers choose this path are practical: speed, certainty of execution, confidentiality, and a customized structure they can negotiate with one counterparty rather than dozens.
The market exists at the scale it does today because of forces set in motion by the 2008 financial crisis. As banks pulled back from middle-market lending under tighter capital rules, non-bank lenders stepped in to fill the void.
Private corporate credit assets under management grew from roughly $0.9 trillion in 2005 to $4.0 trillion in 2025, and its share of the below-investment-grade credit market expanded from 8% to 27% over that period (Blackstone, as of December 31, 2025). Within leveraged buyout financing specifically, private credit’s share jumped from 65% in 2020 to 84% in 2025 (Pitchbook LCD). What was once a niche corner of the credit markets has become the dominant way mid-sized American companies get financed.
Why the Yield in Private Credit is Higher
When you look at the income generated by direct lending, the math comes from three pieces stacked together:
Stack those together and you get income that has historically run about 200 basis points — two full percentage points — above broadly syndicated leveraged loans (J.P. Morgan Research, December 2025).
Why are borrowers willing to pay that premium? Because what they’re buying isn’t just capital — it’s certainty, speed, and a tailored structure. In a public-market debt deal, a borrower may face weeks of marketing, a price that floats with sentiment, and the possibility of a deal pulled if conditions sour. A direct lender can commit at scale in days, with terms that don’t move. For a private equity sponsor trying to close an acquisition, that reliability has real value.
The 200 basis points isn’t a free lunch; it’s the price of execution and customization, and it compounds. An investor who put $10,000 into direct lending ten years ago would have earned roughly 1.4 times the income of the same dollars in leveraged loans over that period (Cliffwater Direct Lending Index, as of December 31, 2025).
Why it’s Defensive, not just Yield-y
It would be a mistake, though, to think of direct lending as simply a higher-yielding version of a bond fund. The structural features of these loans are what give us conviction — they’re built to defend principal, not just to harvest income.
Three features matter most.
First, these loans are senior secured, meaning they sit at the top of the borrower’s capital structure with first claim on assets in a stress scenario. The borrower’s equity owners and junior debt holders absorb losses before the loans take a dollar of impairment.
Second, they’re floating rate, so when short-term rates rise, the income on the loan rises with them, which is why direct lending held up so well during the 2022 bond drawdown that hit traditional fixed income hard.
Third, and perhaps most importantly, the underwriting today is far more conservative than in past credit cycles. The average loan-to-value on direct lending deals is roughly 42%, compared with about 65% before the Global Financial Crisis and as high as 90% in the late 1990s (PitchBook LCD; KBRA DLD).
A useful analogy: think of a home mortgage where the bank lent only 42% of the home’s value. The homeowner would have to lose nearly 60% of their equity before the bank’s loan was even at risk. That’s the kind of equity cushion sitting beneath today’s direct lending portfolios.
The track record bears this out. Over the past 20 years, the S&P 500 has finished in negative territory three times — 2008, 2018, and 2022. In all three of those years, direct lending outperformed both stocks and leveraged loans, and in two of them (2018 and 2022) it generated positive returns while equities posted meaningful drawdowns (Cliffwater Direct Lending Index; Morningstar). None of this means private credit is risk-free. Defaults happen, and managers who underwrite poorly will see losses. But the structural defenses are real, and they’ve held up across cycles.
How it Fits in a Portfolio
Here we want to be careful about framing. Direct lending is not a replacement for traditional bonds. Treasuries and high-grade corporate bonds still play essential roles in a portfolio. They provide deep liquidity, true safe-haven characteristics in equity sell-offs, and the duration exposure that benefits from falling rates. We continue to believe a well-built bond allocation is foundational, and nothing about our private credit thesis changes that.
What direct lending does is sit alongside that bond allocation as a complement — adding income, reducing overall portfolio volatility, and diversifying the drivers of return. The intuition is straightforward: direct lending earns its return from credit spreads and floating short rates rather than from duration, so it tends to behave differently from traditional bonds in the same environment. When rates rise sharply, a bond fund’s price falls; a floating-rate loan portfolio’s income goes up.
An illustration commonly cited in industry research compares a traditional 60/40 stock-bond portfolio with a 60/20/20 portfolio that carves 20% out of the fixed income sleeve and allocates it to direct lending. Over the ten years ending December 31, 2025, that adjustment historically delivered higher annualized returns (10.7% vs. 9.8%), lower volatility (9.5% vs. 10.3%), and a meaningfully higher current yield (4.1% vs. 2.8%) (Bloomberg, Morningstar, Cliffwater).
Past results don’t predict the future, of course, and these are index figures that don’t reflect fund-level fees. But the directional story — better income, lower volatility, broader diversification — is consistent with how we think about the role this sleeve plays in client portfolios.
How Clients Access Private Credit Through Our Portfolios
For most clients, the practical question is: how do I actually own this? Direct lending was historically the province of institutions investing through long-lock-up drawdown funds, with capital calls, distributions, and ten-year commitments. That structure works for pensions and endowments but is poorly suited for individual investors.
The vehicles we use for client portfolios are different. We allocate primarily through semi-liquid, evergreen fund structures — interval funds and perpetual non-traded BDCs (business development companies), with Blackstone’s BCRED serving as one representative example of the category. These funds offer monthly subscriptions, quarterly redemption windows (typically capped at 5% of fund assets per quarter), and continuous deployment of capital, which together make them dramatically more accessible than the traditional drawdown model.
We want to be candid about the tradeoff. These are not daily-liquid like a bond mutual fund. Redemptions are subject to caps and gates that can be triggered in stressed conditions, and the funds are designed for investors who can leave capital invested for multiple years. That illiquidity is real, and in our view, it’s also part of what generates the excess return. The premium investors earn on direct lending is, in part, compensation for accepting limits on daily liquidity. Used appropriately and sized within a client’s broader liquidity plan, we think it’s a tradeoff that has historically paid off.
What We’re Watching
We hold our conviction with both eyes open. Three things keep our attention.
The first is default risk in a slowing economy. Direct lending portfolios are concentrated in leveraged middle-market companies, and if growth weakens materially, defaults will rise. Manager underwriting quality matters far more in that environment than it does in benign conditions. The second is manager dispersion. Returns across direct lending funds vary widely — far more than across, say, large-cap stock funds — and the gap between top and bottom managers can be several hundred basis points a year. Where you invest, and who you invest with, matters enormously. The third is scale and sponsor relationships. The best direct lenders see the most deal flow, can be selective in what they underwrite, and have the balance sheet to commit at the size sponsors need. We deliberately work with established, large-scale institutional managers rather than chasing yield with smaller, newer, or higher-risk vehicles.
Closing
We believe direct lending earns its place in client portfolios, not as a bond replacement, but as an additive complement that improves income, dampens volatility, and broadens the engines of return. The combination of senior secured positioning, floating-rate income, conservative loan-to-values, and the underlying growth of private corporate credit gives us confidence that this is a durable, multi-year opportunity, not a yield fad.
It’s also one piece of a broader private markets framework we use across client portfolios — alongside private equity, private real estate, and private infrastructure — each playing a distinct role. Private credit is the income-and-stability piece. We’ll continue to share our thinking on the others in future articles.
A Truly Unique Wealth Management Experience
Let’s create a financial plan and investment strategy that allows you to live the life of your dreams. Schedule your free consultation today to explore tailored financial strategies designed to secure your future!
Concerns or questions about how your investment portfolio will hold up in the current market environment? Contact Financial Synergies today.
We are a boutique, financial advisory and total wealth management firm with over 35 years helping clients navigate turbulent markets. To learn more about our approach to investment management please reach out to us. One of our seasoned advisors would be happy to help you build a custom financial plan to help ensure you accomplish your financial goals and objectives. Schedule a conversation with us today.
More relevant articles by Financial Synergies:
Footnotes
¹ Private corporate credit assets under management and market share figures sourced from Bloomberg (“High Yield”), LCD (“Senior Loans”), and Preqin (“Private Credit”), as of December 31, 2025, as referenced in Blackstone, Essentials of Private Credit: Direct Lending (Blackstone University, 2025). Total addressable US sub-investment grade credit market defined as the aggregate of US high yield bonds, US leveraged loans, and North American private credit markets. Preqin private credit data as of June 30, 2025, the latest available.
² Private credit share of leveraged buyout (LBO) transaction activity based on count, sourced from PitchBook LCD as of December 31, 2025.
³ Yield premium of approximately 200 basis points represents the historical spread of direct lending over broadly syndicated leveraged loans. Source: J.P. Morgan Research, as of December 2025.
⁴ Income return comparison reflects the growth of $10,000 invested over the ten-year period ending December 31, 2025. Direct lending represented by the Cliffwater Direct Lending Index; leveraged loans represented by the Morningstar LSTA US B Ratings Loans Index. Source: Morningstar, Cliffwater. Past performance does not predict future returns.
⁵ Average loan-to-value (LTV) figures: “Late 1990s” reflects approximate leverage through high yield bonds used to finance major buyouts in the 1990s; “Pre-GFC” reflects approximate leverage through leveraged loans used to finance US buyouts from 2000 to 2007 (source: PitchBook LCD); “Today” reflects the average LTV on mid- and upper-market M&A deals completed during Q4 2025 (source: KBRA DLD).
⁶ Annual return comparisons for 2008, 2018, and 2022 sourced from Morningstar Direct, as of December 31, 2025. S&P 500 represented by the S&P 500 Index; leveraged loans by the Morningstar LSTA US Leveraged Loan Index; direct lending by the Cliffwater Direct Lending Index. The Cliffwater Direct Lending Index has an inception date of October 2015; pre-2016 direct lending figures are based on data from index constituents and predecessor methodologies as reported by Cliffwater.
⁷ Portfolio illustration compares a traditional 60/40 portfolio (60% S&P 500 Index / 40% Bloomberg US Aggregate Bond Index) to a 60/20/20 portfolio (60% S&P 500 / 20% Bloomberg US Aggregate / 20% Cliffwater Direct Lending Index) over the ten-year period from January 2016 to December 2025. Annualized returns and volatility calculated based on quarterly returns. Yield calculated using the annualized S&P 500 dividend yield, annualized Bloomberg US Aggregate Bond yield, and annual Cliffwater Direct Lending Index income return. Source: Bloomberg, Morningstar, Cliffwater. The figures shown are based on unmanaged index data, do not reflect fees or expenses that would be borne by an investor in any actual fund or strategy, and do not represent the performance of any Financial Synergies portfolio. Past performance does not predict future returns.
⁸ Business Development Companies (BDCs) are a type of closed-end investment vehicle established under the Investment Company Act of 1940 that invest primarily in privately held middle-market companies. Non-traded BDCs are not listed on a public exchange and typically offer periodic liquidity through quarterly share repurchase programs, generally capped at a percentage of fund assets (often approximately 5% per quarter). Such repurchase programs may be modified, suspended, or terminated by the fund’s board.
⁹ Reference to Blackstone Private Credit Fund (BCRED) is illustrative of the perpetual non-traded BDC fund category only and is not a recommendation, endorsement, or solicitation. Financial Synergies evaluates and selects private credit vehicles based on a range of factors including manager scale, underwriting discipline, sponsor relationships, fee structure, and fit within client portfolios. Specific funds used in client portfolios may differ.
Disclosure
This article is provided for educational and informational purposes only and does not constitute investment, legal, tax, or accounting advice. The views expressed are those of Financial Synergies Wealth Advisors as of the date of publication and are subject to change without notice. Nothing herein should be construed as an offer to sell, or a solicitation of an offer to buy, any security or investment product.
Past performance is not indicative of future results. Any references to historical returns, index data, or hypothetical portfolio illustrations (including comparisons between direct lending, leveraged loans, high yield bonds, investment grade bonds, and traditional 60/40 portfolio allocations) are presented for illustrative purposes only and reflect specific methodologies, time periods, and assumptions that may not be representative of future market conditions. Index comparisons have inherent limitations: the indices referenced — including the Cliffwater Direct Lending Index, the Morningstar LSTA US Leveraged Loan Index, the Bloomberg US Corporate High Yield Index, the Bloomberg US Aggregate Bond Index, and the S&P 500 Index — are unmanaged, do not reflect the deduction of fees or expenses, and may differ materially in composition, risk profile, and liquidity from any fund or strategy in which a client may invest.
Investments in private credit involve risk and are suitable only for eligible investors. Private credit investments are illiquid, have limited or no secondary market, may involve significant fees and expenses, and typically require medium- to long-term holding periods. Even evergreen and semi-liquid fund structures — including interval funds and perpetual non-traded business development companies (BDCs) — impose restrictions on redemptions, including periodic liquidity windows, redemption gates (typically capped as a percentage of fund assets per quarter), and the possibility that redemption requests may be limited, prorated, or suspended during periods of market stress. Direct lending investments are subject to credit risk, default risk, interest rate risk, and the risk that floating-rate income may decline if benchmark rates fall. Loan valuations are typically performed periodically and may not reflect realizable values. The senior secured nature of direct lending loans, lower loan-to-value ratios, and other structural protections referenced in this article seek to mitigate risk but do not eliminate it and do not protect against losses. There can be no assurance that any private credit strategy will achieve its objectives or avoid losses.
Diversification does not ensure a profit or protect against loss in declining markets. Manager selection is a critical component of private credit investing given the wide dispersion of returns among managers, and there can be no assurance that any selected manager will achieve results comparable to historical industry averages or to the indices referenced herein. References to specific funds or sponsors, including Blackstone’s BCRED, are illustrative of fund structure and category only and do not constitute a recommendation, endorsement, or solicitation with respect to any particular investment.
Private credit investments are generally available only to accredited investors and qualified purchasers as defined under federal securities laws. The suitability of any investment depends on each client’s individual financial circumstances, liquidity needs, time horizon, and goals. Clients should consult with their advisor before making any investment decision.
Financial Synergies Wealth Advisors is an SEC-registered investment adviser. Registration does not imply any particular level of skill or training. Additional information about our firm, including our investment strategies, fees, and potential conflicts of interest, is available in our Form ADV Part 2A, which is available upon request or at adviserinfo.sec.gov.
Certain data referenced in this article has been obtained from third-party sources believed to be reliable, including Blackstone, Cliffwater, Morningstar, Bloomberg, J.P. Morgan Research, PitchBook LCD, KBRA DLD, and Preqin. Financial Synergies has not independently verified this information and makes no representation as to its accuracy or completeness.
Recent Posts
Weekly Market Recap – September Inflation & Retail Sales Data, AI Financing, & Bank Earnings
Happy Birthday to the Bull Market
Quarterly Webinar: Q4 2026 Market and Economic Themes
Subscribe to Our Blog
Chief Investment Officer | Managing Partner