3rd Quarter 2026 Market and Economic Review
Key Updates on the Economy & Markets
The third quarter combined solid economic and corporate fundamentals with renewed pressure from oil and interest rates. Oil traded back above $100 per barrel, inflation remained elevated, Treasury yields surged higher, and the Federal Reserve raised rates in September.
The S&P 500 traded higher and set a new all-time high as corporate earnings and economic activity remained strong, but beneath the headline gain, market leadership narrowed as smaller companies and rate-sensitive areas lagged. Meanwhile, artificial intelligence continued to play a large role in both the economy and financial markets. In this market and economic recap, we look at the forces pushing interest rates higher, the economic and earnings strength helping offset those pressures, and AI’s expanding influence on everyday borrowing costs, business investment, and the stock market.
If you would prefer to download a PDF copy of this report, one is provided here: 3rd Quarter 2026 Market Review.
Fed Raises Interest Rates as Oil Remains Volatile
Oil remained a major driver during the third quarter, with sharp price swings carrying implications for inflation, interest rates, and economic growth. The top chart in Figure 1 graphs the monthly change in oil prices this year, highlighting how frequently prices have changed direction. After surging early in the year, oil fell sharply in May and June before reversing higher again in Q3, with a +22% increase in July. The main takeaway isn’t any single monthly move, but how frequently the direction changed.
Most of the volatility is tied to changing expectations for Middle East oil supplies and the uncertainty around the Strait of Hormuz. Those swings in oil prices matter beyond the energy market because oil feeds into gasoline and transportation costs, inflation, and ultimately the outlook for interest rates and economic growth. When oil fell in Q2, some of those pressures eased. As prices moved higher again in Q3, concerns about inflation and the path of interest rates resurfaced. The changing backdrop had a significant impact on the interest rate outlook. Earlier in the year, investors were focused on how much the Fed could lower rates. However, as oil rebounded and inflation remained above the Fed’s target level, the discussion gradually shifted toward whether policymakers would need to raise interest rates instead.
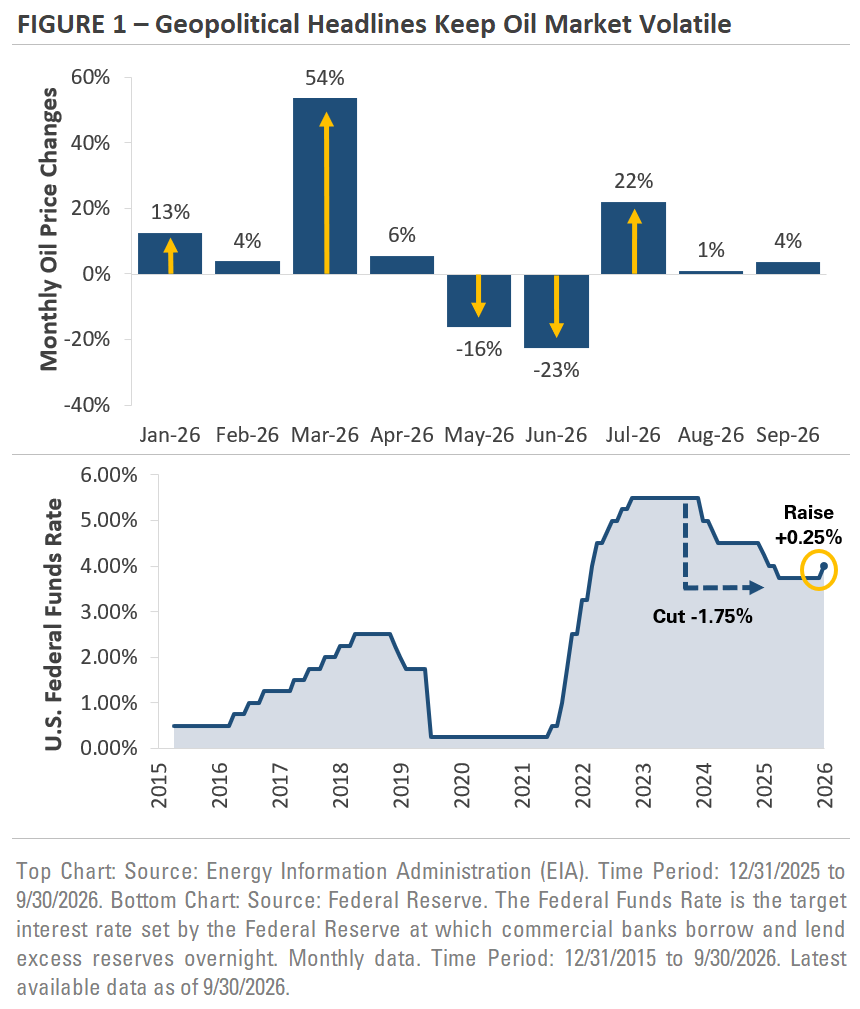
The bottom chart in Figure 1 shows the impact on Fed policy. After cutting rates by -1.75% since September 2024, the Fed held rates steady for most of this year. Following a 9-month pause, the central bank raised rates by +0.25% in September, the first increase since 2023. The market expects additional hikes in the coming quarters, although those expectations have changed frequently throughout the year. The broader takeaway is that the path for interest rates remains closely tied to how inflation, oil prices, and economic growth develop into year-end and early 2027.
Strong Earnings and Economic Growth Provide Fundamental Support Amid Volatility
The volatility in oil, inflation, and interest rates made the economic backdrop more complicated, but the underlying data remained strong, providing fundamental support to the stock market. Corporate earnings remained strong, and households and businesses continued to spend, providing a constructive counterpoint to the quarter’s uncertainty.
The top chart in Figure 2 graphs the year-over-year growth rate of S&P 500 earnings since 2001. It shows corporate earnings have remained strong, with the S&P 500’s 12-month earnings growing nearly +30% over the past year. It’s one of the strongest periods of earnings growth outside of the post-financial crisis and post-COVID rebounds and is a significant improvement from the single-digit pace seen in 2023 and 2024. The earnings data stood in contrast to the more volatile macro backdrop, with corporate profits continuing to grow at a strong pace.
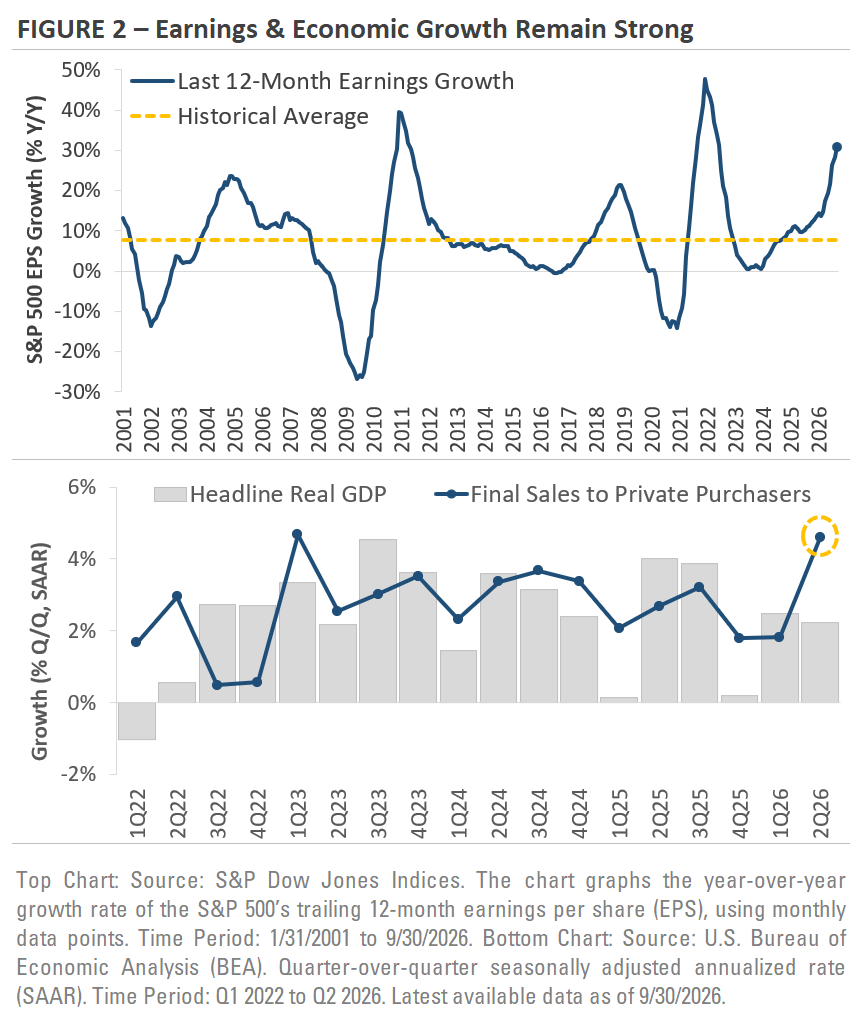
The bottom chart looks beneath headline GDP growth to show what households and businesses were doing. Headline GDP includes volatile categories such as trade, inventories, and government spending, while the second measure, final sales to private purchasers, focuses more on consumer spending and private investment. Comparing the two helps show whether changes in overall growth reflect the underlying economy or temporary swings. In the second quarter, headline GDP grew at a +2.2% annualized rate, down from +2.5% in Q1, while underlying private demand grew +4.6%. The gap suggests households and businesses were still spending and investing at a healthy pace even as the broader economic backdrop became more volatile.
The two charts help explain why markets were able to absorb the quarter’s volatility. Consumers continue to spend, businesses keep investing, and corporate earnings remain strong. The combination provides an offset to higher oil prices, persistent inflation, and rising interest rates.
AI’s Influence on Economic Growth and Financial Markets Continues to Broaden
Artificial intelligence has been a major market theme for several years, but the scale of the buildout is making it more important to the broader economy and financial markets. Figure 3 shows three ways AI’s influence is expanding: investment, financing, and the stock market itself.
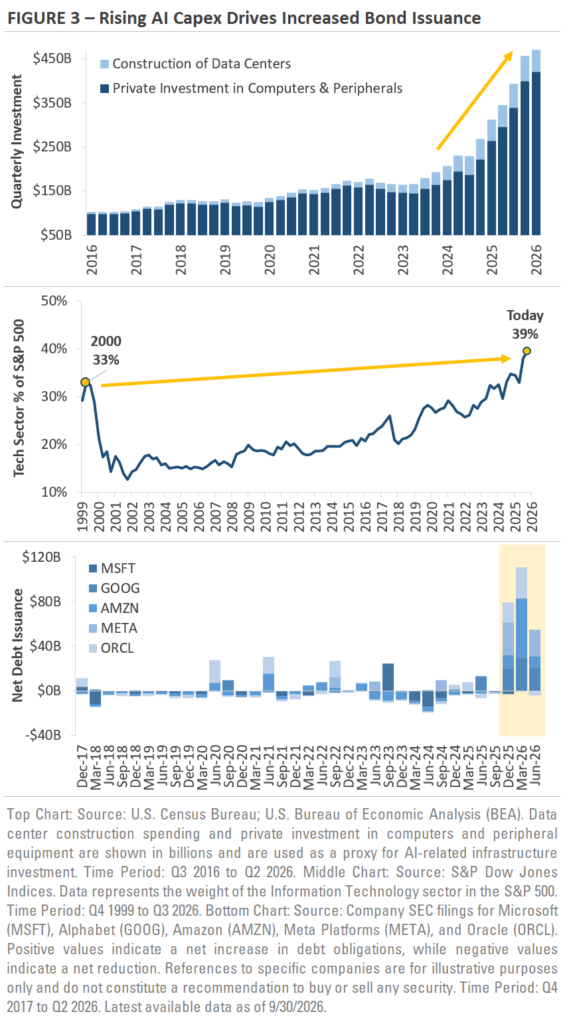
The first is business investment. The top chart graphs spending on data-center construction and computer equipment, which together provide a proxy for the physical infrastructure being built to support AI. Combined investment has increased from roughly $180 billion at the end of 2023 to nearly $490 billion today, making AI-related infrastructure an important source of business investment.
The second impact is the stock market. The middle chart shows that Technology now accounts for nearly 40% of the S&P 500, up from about 34% at the end of 2025. As that share has increased, the index has become more sensitive to the performance of its largest sector. As a result, strong AI-related earnings and stock gains can have an outsized influence on the broader index.
The third impact relates to financing. Major U.S. tech companies remain highly profitable, but the scale of their AI investment programs has grown quickly. The bottom chart shows that several of these companies are increasingly using the bond market to help finance the buildout. The group historically was more balanced in issuing and reducing debt, but the right side of the chart shows a significant jump in new debt issuance. The main takeaway is that AI’s influence is no longer limited to business investment and the stock market; the scale of the buildout is also driving a surge in bond issuance and reshaping the broader capital markets.
The three charts show how AI has moved beyond a narrow technology theme. The buildout is supporting business investment, drawing on the bond market for financing, and carrying increasing weight in the stock market. Its growing scale means AI is now influencing several parts of the economy and financial markets at the same time.
Equity Market Recap – Market Leadership Narrows Late in Q3 as Interest Rates Rise
The S&P 500 finished Q3 higher and set a new all-time high, but the quarter was marked by an uneven return path and growing divergence beneath the index. Stocks faced some pressure early in the quarter before rebounding in August, when the Russell 2000, Dow Jones, and equal-weight S&P 500 each set new highs. From there, leadership narrowed as larger companies outperformed smaller ones into quarter-end.
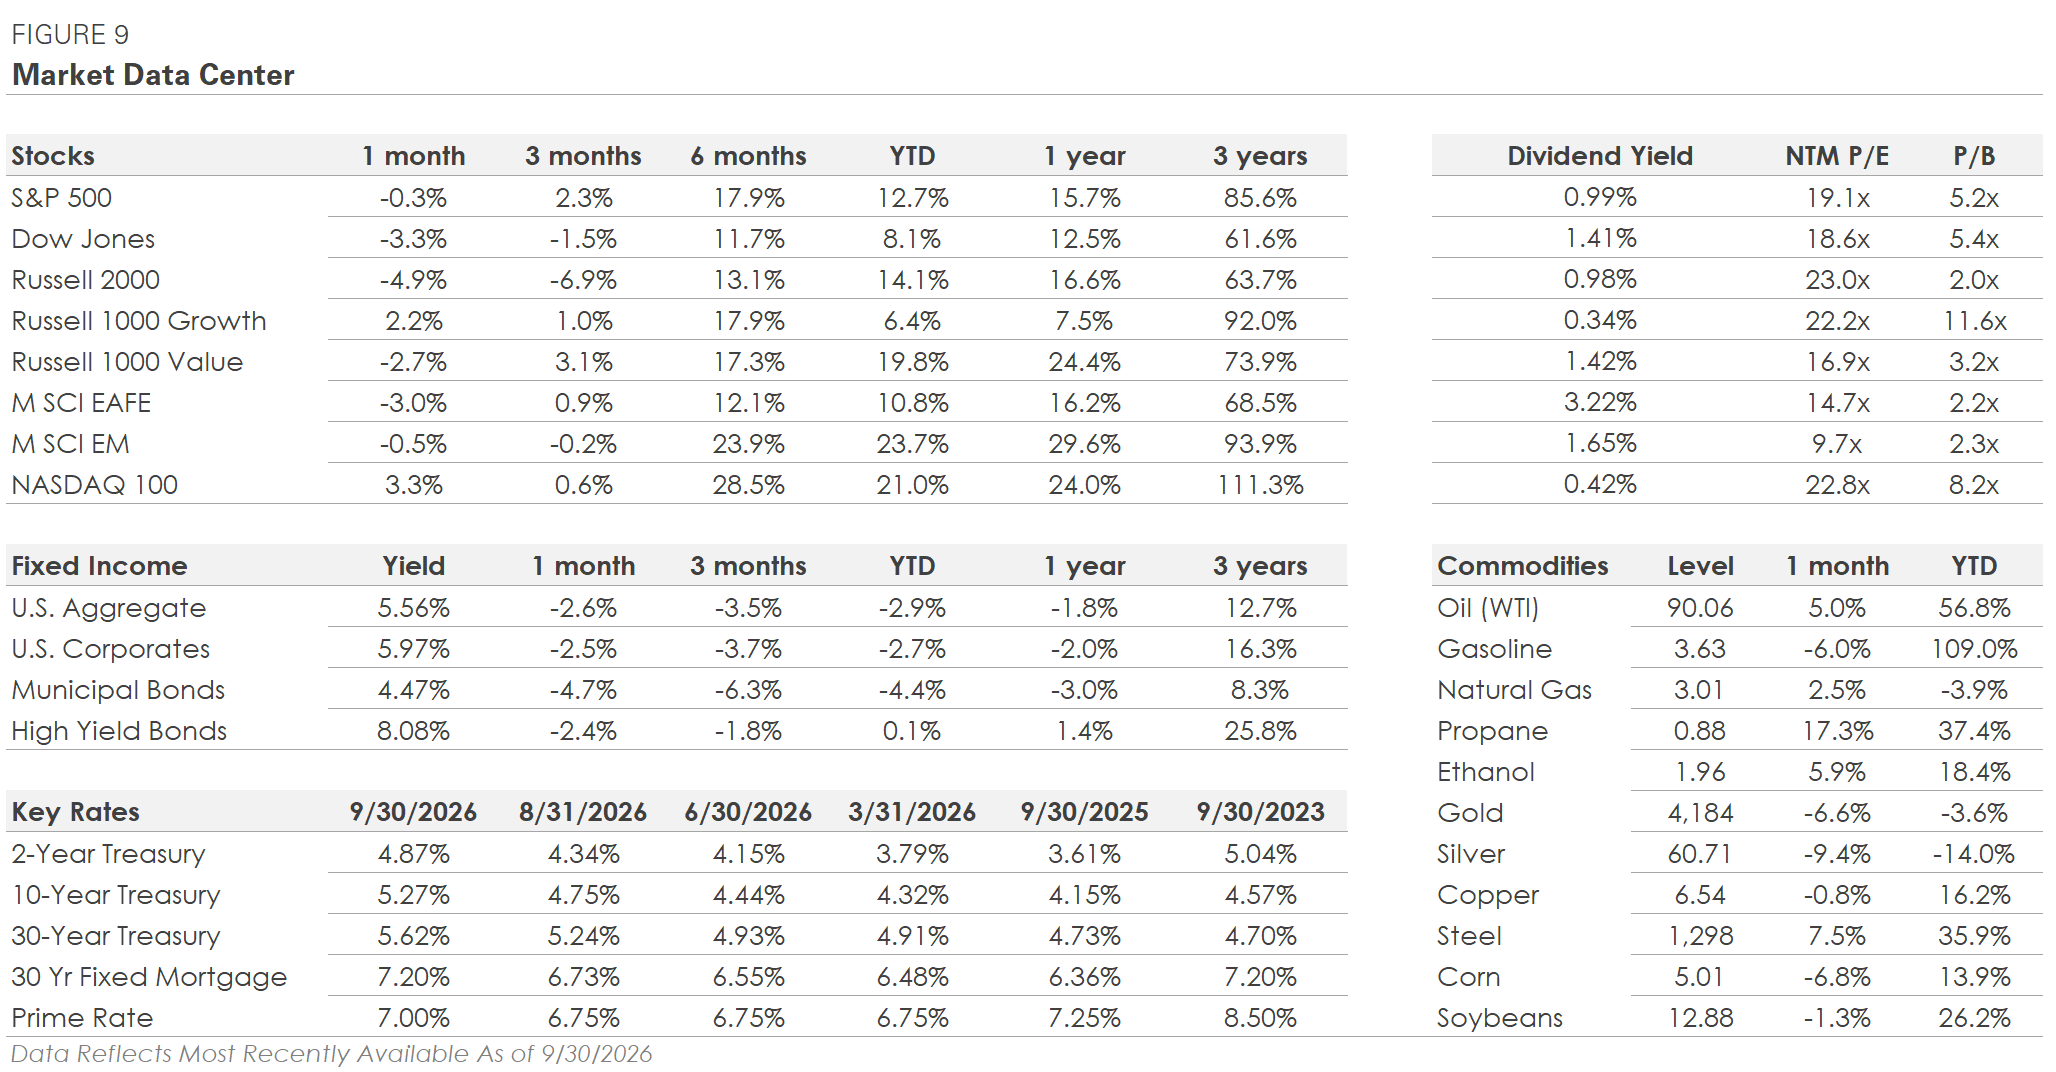
The S&P 500 finished the quarter with a +2.3% gain, compared with +0.6% for the Nasdaq 100, -1.5% for the Dow Jones, and -6.9% for the Russell 2000. Most of the performance gap developed during the second half of the quarter, which overlapped with a sharp rise in Treasury yields. The timing suggests rising interest rates contributed to the return divergence across markets, as smaller companies tend to be more sensitive to borrowing costs.
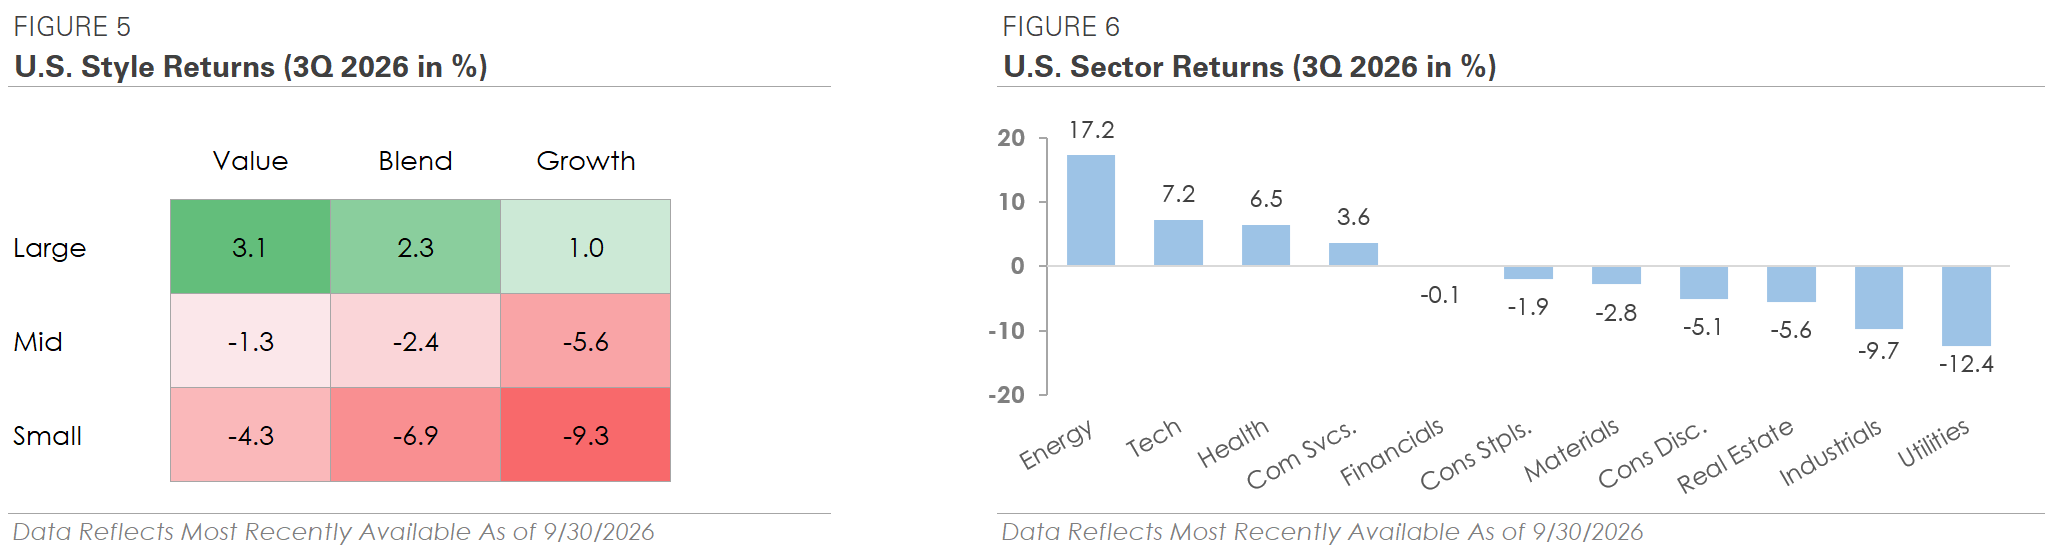
Sector performance reflected many of the quarter’s primary themes. Four of the eleven S&P 500 sectors outperformed the broad index, signaling narrow breadth. Energy was the top-performing sector with a +17.2% gain as oil climbed from around $70 per barrel in early July to more than $100 by mid-September. Energy’s outperformance was a reversal from Q2, when it was the bottom-performing sector as oil prices fell. Technology was the second-best performing sector and gained +7.2%, followed by Health Care at +6.5% and Communication Services at +3.6%. In contrast, Utilities fell -12.4% as interest rates rose, while Industrials fell -9.7% and Real Estate declined -5.6%.
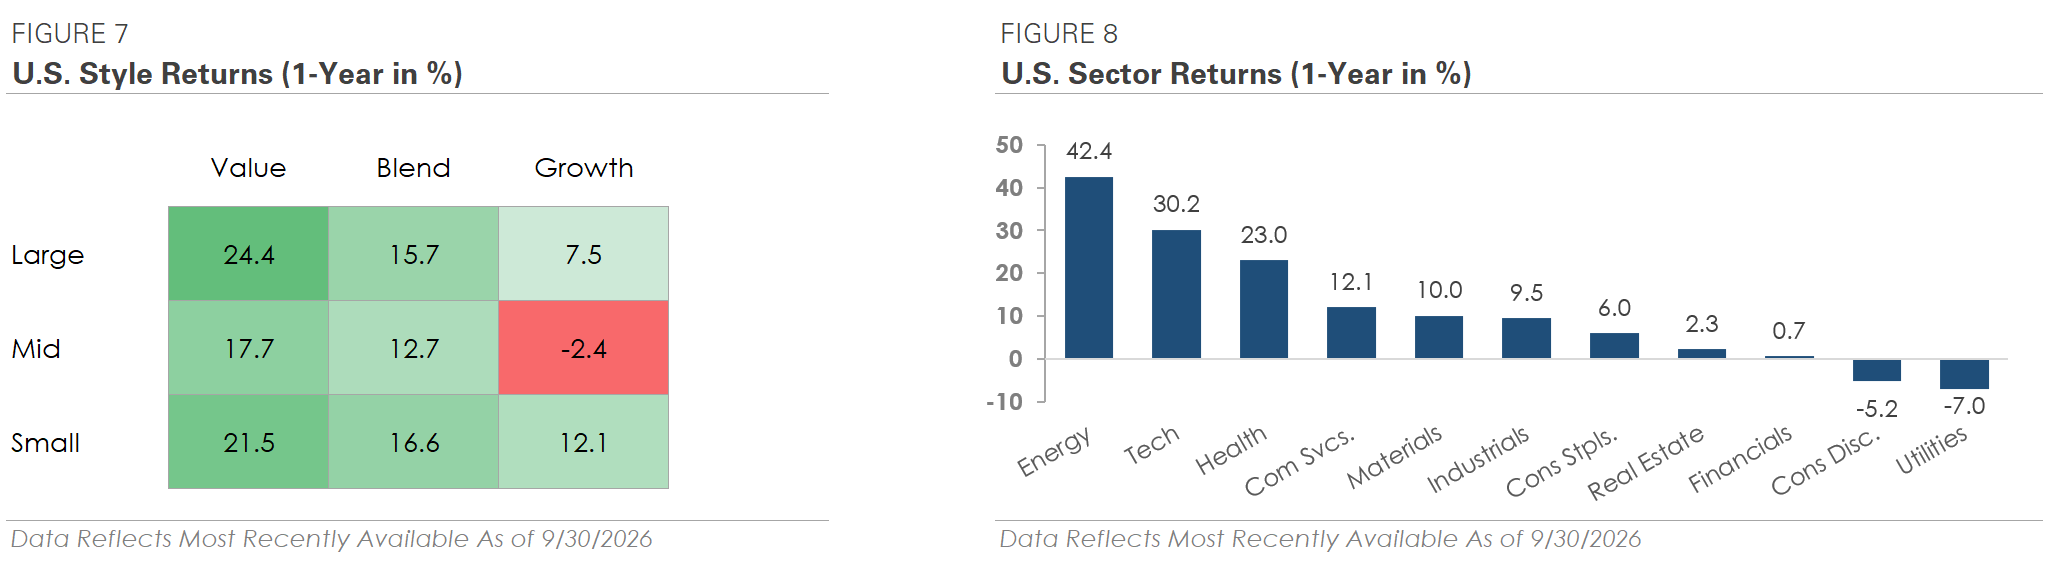
International markets were relatively quiet after their gains in the first half of the year. Developed and emerging market stocks each finished the quarter within 1% of where they started, with developed modestly outperforming emerging. Both international regions are up year-to-date despite ending the quarter flat and are still outperforming the S&P 500 over the past 12 months.
The quarter ultimately produced a mixed picture beneath the major indexes. The S&P 500 finished higher and reached a new all-time high, while smaller companies and several rate-sensitive areas traded lower as Treasury yields rose later in the quarter. The divergence of returns left market leadership narrower than it was in August, with major U.S. equity indexes still higher year-to-date.
Credit Market Recap – Rising Interest Rates Weigh on Bond Prices and Fixed Income Portfolios
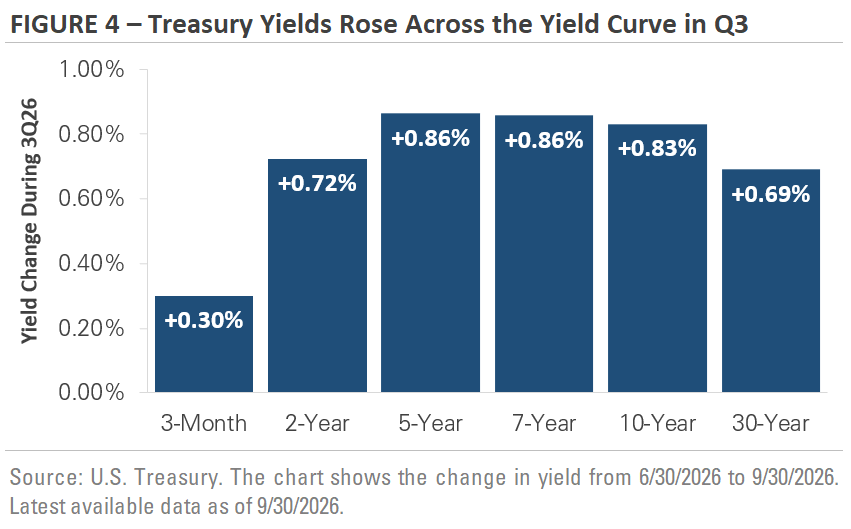
The third quarter was challenging for bonds as Treasury yields surged higher. Figure 4 graphs the change in yield across various maturities during Q3. It shows that yields increased at each maturity, with the 5-year, 7-year, and 10-year Treasury yields each rising more than +0.80% and the 30-year yield increased nearly +0.70%. Longer-maturity bonds underperformed because of their higher sensitivity to changes in interest rates, while shorter-maturity Treasuries held up better on a relative basis despite trading lower.
Corporate bonds also came under pressure from the rise in Treasury yields, although they outperformed government bonds. High-yield produced a total return of -1.8% and outperformed investment-grade’s -3.7%, which was more impacted by rising rates due to its longer maturity. For most of the quarter, the primary headwind was rising interest rates rather than weakening credit conditions. Investment-grade and broad high-yield spreads remained relatively stable and tight by historical standards, suggesting investors were still comfortable with corporate fundamentals even as borrowing costs increased.
The clearest sign of caution appeared at the lowest-quality end of the high-yield bond market. Spreads on CCC-rated bonds, which are the lowest-rated high-yield bonds, widened even as spreads on higher-quality high-yield bonds held steady. The trend indicates investors started demanding more compensation to hold the debt of financially weaker borrowers. While broader high-yield spreads were comparatively calm for most of Q3, they also started to widen in late September. The move suggests the market became more selective as the quarter progressed, with the impact of higher financing costs showing up first among the most sensitive borrowers.
Q3’s bond-market weakness was driven mainly by rising Treasury yields rather than a broad deterioration in corporate credit. High-yield spreads widened late in the quarter, particularly among the lowest-quality borrowers, but investment-grade and broader high-yield spreads remained relatively contained. The distinction suggests higher financing costs were creating pressure in pockets of the market rather than across the full credit market.
2026 Outlook – What to Watch in Q4
Economic growth and corporate earnings remain strong heading into Q4, even as higher oil prices and interest rates have created a mixed and volatile backdrop. One of the main questions heading into Q4 is whether the underlying strength continues as households and businesses adjust to higher borrowing costs, persistent inflation pressure, and continued uncertainty around energy prices.
The economy has handled those pressures relatively well thus far. Consumers have continued to spend, businesses have kept investing, and unemployment has remained low. Those trends have helped support economic growth even as interest rates and borrowing costs have risen. The coming months will provide a clearer read on whether the momentum continues, particularly economic data that tracks consumer spending, hiring, and business investment.
Corporate earnings will be another important source of information. Profit growth has been strong over the past year and provided fundamental support to the market amidst a volatile macro backdrop. Q3 earnings season, which begins in October, will provide an updated look at how companies are managing higher interest rates, changing input costs, and continued investment while maintaining revenue and profit growth.
The AI investment cycle will remain an important part of the discussion as well. Spending on data centers, computing equipment, and related infrastructure continues to support business investment, while large technology companies are increasingly using the bond market to help finance the buildout. As the cycle matures, the focus is likely to broaden from how much is being spent to what that investment is producing in revenue, profits, and productivity.
Markets have absorbed several changes this year without losing their underlying support from economic growth and corporate earnings. We will continue watching how these trends develop while keeping the focus on portfolio diversification, discipline, and meeting your long-term financial goals across a range of possible outcomes.
A Truly Unique Wealth Management Experience
Let’s create a financial plan and investment strategy that allows you to live the life of your dreams. Schedule your free consultation today to explore tailored financial strategies designed to secure your future!
Are We Right for You?
THIS QUARTER IN NUMBERS
Market and Economic Data Disclosures
The information and opinions provided herein are provided as general market commentary only and are subject to change at any time without notice. This commentary may contain forward-looking statements that are subject to various risks and uncertainties. None of the events or outcomes mentioned here may come to pass, and actual results may differ materially from those expressed or implied in these statements. No mention of a particular security, index, or other instrument in this report constitutes a recommendation to buy, sell, or hold that or any other security, nor does it constitute an opinion on the suitability of any security or index. The report is strictly an informational publication and has been prepared without regard to the particular investments and circumstances of the recipient.
Past performance does not guarantee or indicate future results. Any index performance mentioned is for illustrative purposes only and does not reflect any management fees, transaction costs, or expenses. Indexes are unmanaged, and one cannot invest directly in an index. Index performance does not represent the actual performance that would be achieved by investing in a fund.
Stock performance and fundamental data is based on the following instruments: SPDR S&P 500 ETF (SPY), SPDR Dow Jones ETF (DIA), iShares Russell 2000 ETF (IWM), iShares Russell 1000 Growth ETF (IWF), iShares Russell 1000 Value ETF (IWD), iShares MSCI EAFE ETF (EFA), iShares MSCI Emerging Markets ETF (EEM), Invesco QQQ Trust (QQQ).
Fixed Income performance is based on the following instruments: iShares Core U.S. Aggregate Bond ETF (AGG), iShares Investment Grade Corporate ETF (LQD), iShares National Muni Bond ETF (MUB), iShares High Yield Corporate ETF (HYG).
Fixed Income yields and key rates are based on the following instruments: Bloomberg US Aggregate, ICE BofA US Corporate, ICE BofA US Municipal Securities, ICE BofA US High Yield, 2 Year US Benchmark Bond, 10 Year US Benchmark Bond, 30 Year US Benchmark Bond, 30 Year US Fixed Mortgage Rate, US Prime Rate.
Commodity prices are based on the following instruments: Crude Oil WTI (NYM $/bbl), Gasoline Regular U.S. Gulf Coast ($/gal), Natural Gas (NYM $/mmbtu), Propane (NYM $/gal), Ethanol (CRB $/gallon), Gold (NYM $/ozt), Silver (NYM $/ozt), Copper NYMEX ($/lb), U.S. Midwest Domestic Hot-Rolled Coil Steel (NYM $/st), Corn (CBT $/bu), Soybeans (Chicago $/bu).
U.S. Style performance is based on the following instruments: iShares Russell 1000 Value ETF (IWD), SPDR S&P 500 ETF Trust (SPY), iShares Russell 1000 Growth ETF (IWF), iShares Russell Mid-Cap Value ETF (IWS), iShares Russell Midcap ETF (IWR), iShares Russell MidCap Growth ETF (IWP), iShares Russell 2000 Value ETF (IWN), iShares Russell 2000 ETF (IWM), iShares Russell 2000 Growth ETF (IWO).
U.S. Sector performance is based on the following instruments: Consumer Discretionary Sector SPDR ETF (XLY), Consumer Staples Sector SPDR ETF (XLP), Energy Sector SPDR ETF (XLE), Financial Sector SPDR ETF (XLF), Health Care Sector SPDR ETF (XLV), Industrial Sector SPDR ETF (XLI), Materials Sector SPDR ETF (XLB), Technology Sector SPDR ETF (XLK), Communication Services Sector SPDR ETF (XLC), Utilities Sector SPDR ETF (XLU), Real Estate Sector SPDR ETF (XLRE).
Concerns or questions about how your investment portfolio will hold up in the current market environment? Contact Financial Synergies today.
We are a boutique, financial advisory and total wealth management firm with over 35 years helping clients navigate turbulent markets. To learn more about our approach to investment management please reach out to us. One of our seasoned advisors would be happy to help you build a custom financial plan to help ensure you accomplish your financial goals and objectives. Schedule a conversation with us today.
More relevant articles by Financial Synergies:
Blog Disclosures
This content, which may contain security-related opinions and/or information, is provided for informational purposes only and should not be relied upon in any manner as professional advice, or an endorsement of any practices, products or services. There can be no guarantees or assurances that the views expressed here will be applicable for any particular facts or circumstances, and should not be relied upon in any manner. You should consult your own financial advisors as to legal, business, tax, and other related matters concerning any investment.
The commentary in this “post” (including any related blogs, videos, and social media) reflects the personal opinions, viewpoints, and analyses of the Financial Synergies Wealth Advisors, Inc. employees providing such comments, and should not be regarded as the views of Financial Synergies Wealth Advisors, Inc. or its respective affiliates or as a description of advisory services provided by Financial Synergies Wealth Advisors, Inc. or performance returns of any Financial Synergies Wealth Advisors, Inc. client.
Any opinions expressed herein do not constitute or imply endorsement, sponsorship, or recommendation by Financial Synergies Wealth Advisors, Inc. or its employees. The views reflected in the commentary are subject to change at any time without notice.
Nothing on this website or Blog constitutes investment or financial planning advice, performance data or any recommendation that any particular security, portfolio of securities, transaction or investment strategy is suitable for any specific person. It also should not be construed as an offer soliciting the purchase or sale of any security mentioned. Nor should it be construed as an offer to provide investment advisory services by Financial Synergies Wealth Advisors, Inc.
Any mention of a particular security and related performance data is not a recommendation to buy or sell that security. Financial Synergies Wealth Advisors, Inc. manages its clients’ accounts using a variety of investment techniques and strategies, which are not necessarily discussed in the commentary. Investments in securities involve the risk of loss. Past performance is no guarantee of future results.
Any charts provided here or on any related Financial Synergies Wealth Advisors, Inc. personnel content outlets are for informational purposes only, and should also not be relied upon when making any investment decision. Any indices referenced for comparison are unmanaged and cannot be invested into directly. As always please remember investing involves risk and possible loss of principal capital; please seek advice from a licensed professional. Any projections, estimates, forecasts, targets, prospects and/or opinions expressed in these materials are subject to change without notice and may differ or be contrary to opinions expressed by others. Information in charts have been obtained from third-party sources and data, and may include those from portfolio securities of funds managed by Financial Synergies Wealth Advisors, Inc. While taken from sources believed to be reliable, Financial Synergies Wealth Advisors, Inc. has not independently verified such information and makes no representations about the enduring accuracy of the information or its appropriateness for a given situation. All content speaks only as of the date indicated.
Financial Synergies Wealth Advisors, Inc. is a registered investment adviser. Advisory services are only offered to clients or prospective clients where Financial Synergies Wealth Advisors, Inc. and its representatives are properly licensed or exempt from licensure. Investments in securities involve the risk of loss. Past performance is no guarantee of future results.
See Full Disclosures Page Here
 Skip to content


3rd Quarter 2026 Market and Economic Review
3rd Quarter 2026 Market and Economic Review
Key Updates on the Economy & Markets
The third quarter combined solid economic and corporate fundamentals with renewed pressure from oil and interest rates. Oil traded back above $100 per barrel, inflation remained elevated, Treasury yields surged higher, and the Federal Reserve raised rates in September.
The S&P 500 traded higher and set a new all-time high as corporate earnings and economic activity remained strong, but beneath the headline gain, market leadership narrowed as smaller companies and rate-sensitive areas lagged. Meanwhile, artificial intelligence continued to play a large role in both the economy and financial markets. In this market and economic recap, we look at the forces pushing interest rates higher, the economic and earnings strength helping offset those pressures, and AI’s expanding influence on everyday borrowing costs, business investment, and the stock market.
If you would prefer to download a PDF copy of this report, one is provided here: 3rd Quarter 2026 Market Review.
Fed Raises Interest Rates as Oil Remains Volatile
Oil remained a major driver during the third quarter, with sharp price swings carrying implications for inflation, interest rates, and economic growth. The top chart in Figure 1 graphs the monthly change in oil prices this year, highlighting how frequently prices have changed direction. After surging early in the year, oil fell sharply in May and June before reversing higher again in Q3, with a +22% increase in July. The main takeaway isn’t any single monthly move, but how frequently the direction changed.
Most of the volatility is tied to changing expectations for Middle East oil supplies and the uncertainty around the Strait of Hormuz. Those swings in oil prices matter beyond the energy market because oil feeds into gasoline and transportation costs, inflation, and ultimately the outlook for interest rates and economic growth. When oil fell in Q2, some of those pressures eased. As prices moved higher again in Q3, concerns about inflation and the path of interest rates resurfaced. The changing backdrop had a significant impact on the interest rate outlook. Earlier in the year, investors were focused on how much the Fed could lower rates. However, as oil rebounded and inflation remained above the Fed’s target level, the discussion gradually shifted toward whether policymakers would need to raise interest rates instead.
The bottom chart in Figure 1 shows the impact on Fed policy. After cutting rates by -1.75% since September 2024, the Fed held rates steady for most of this year. Following a 9-month pause, the central bank raised rates by +0.25% in September, the first increase since 2023. The market expects additional hikes in the coming quarters, although those expectations have changed frequently throughout the year. The broader takeaway is that the path for interest rates remains closely tied to how inflation, oil prices, and economic growth develop into year-end and early 2027.
Strong Earnings and Economic Growth Provide Fundamental Support Amid Volatility
The volatility in oil, inflation, and interest rates made the economic backdrop more complicated, but the underlying data remained strong, providing fundamental support to the stock market. Corporate earnings remained strong, and households and businesses continued to spend, providing a constructive counterpoint to the quarter’s uncertainty.
The top chart in Figure 2 graphs the year-over-year growth rate of S&P 500 earnings since 2001. It shows corporate earnings have remained strong, with the S&P 500’s 12-month earnings growing nearly +30% over the past year. It’s one of the strongest periods of earnings growth outside of the post-financial crisis and post-COVID rebounds and is a significant improvement from the single-digit pace seen in 2023 and 2024. The earnings data stood in contrast to the more volatile macro backdrop, with corporate profits continuing to grow at a strong pace.
The bottom chart looks beneath headline GDP growth to show what households and businesses were doing. Headline GDP includes volatile categories such as trade, inventories, and government spending, while the second measure, final sales to private purchasers, focuses more on consumer spending and private investment. Comparing the two helps show whether changes in overall growth reflect the underlying economy or temporary swings. In the second quarter, headline GDP grew at a +2.2% annualized rate, down from +2.5% in Q1, while underlying private demand grew +4.6%. The gap suggests households and businesses were still spending and investing at a healthy pace even as the broader economic backdrop became more volatile.
The two charts help explain why markets were able to absorb the quarter’s volatility. Consumers continue to spend, businesses keep investing, and corporate earnings remain strong. The combination provides an offset to higher oil prices, persistent inflation, and rising interest rates.
AI’s Influence on Economic Growth and Financial Markets Continues to Broaden
Artificial intelligence has been a major market theme for several years, but the scale of the buildout is making it more important to the broader economy and financial markets. Figure 3 shows three ways AI’s influence is expanding: investment, financing, and the stock market itself.
The first is business investment. The top chart graphs spending on data-center construction and computer equipment, which together provide a proxy for the physical infrastructure being built to support AI. Combined investment has increased from roughly $180 billion at the end of 2023 to nearly $490 billion today, making AI-related infrastructure an important source of business investment.
The second impact is the stock market. The middle chart shows that Technology now accounts for nearly 40% of the S&P 500, up from about 34% at the end of 2025. As that share has increased, the index has become more sensitive to the performance of its largest sector. As a result, strong AI-related earnings and stock gains can have an outsized influence on the broader index.
The third impact relates to financing. Major U.S. tech companies remain highly profitable, but the scale of their AI investment programs has grown quickly. The bottom chart shows that several of these companies are increasingly using the bond market to help finance the buildout. The group historically was more balanced in issuing and reducing debt, but the right side of the chart shows a significant jump in new debt issuance. The main takeaway is that AI’s influence is no longer limited to business investment and the stock market; the scale of the buildout is also driving a surge in bond issuance and reshaping the broader capital markets.
The three charts show how AI has moved beyond a narrow technology theme. The buildout is supporting business investment, drawing on the bond market for financing, and carrying increasing weight in the stock market. Its growing scale means AI is now influencing several parts of the economy and financial markets at the same time.
Equity Market Recap – Market Leadership Narrows Late in Q3 as Interest Rates Rise
The S&P 500 finished Q3 higher and set a new all-time high, but the quarter was marked by an uneven return path and growing divergence beneath the index. Stocks faced some pressure early in the quarter before rebounding in August, when the Russell 2000, Dow Jones, and equal-weight S&P 500 each set new highs. From there, leadership narrowed as larger companies outperformed smaller ones into quarter-end.
The S&P 500 finished the quarter with a +2.3% gain, compared with +0.6% for the Nasdaq 100, -1.5% for the Dow Jones, and -6.9% for the Russell 2000. Most of the performance gap developed during the second half of the quarter, which overlapped with a sharp rise in Treasury yields. The timing suggests rising interest rates contributed to the return divergence across markets, as smaller companies tend to be more sensitive to borrowing costs.
Sector performance reflected many of the quarter’s primary themes. Four of the eleven S&P 500 sectors outperformed the broad index, signaling narrow breadth. Energy was the top-performing sector with a +17.2% gain as oil climbed from around $70 per barrel in early July to more than $100 by mid-September. Energy’s outperformance was a reversal from Q2, when it was the bottom-performing sector as oil prices fell. Technology was the second-best performing sector and gained +7.2%, followed by Health Care at +6.5% and Communication Services at +3.6%. In contrast, Utilities fell -12.4% as interest rates rose, while Industrials fell -9.7% and Real Estate declined -5.6%.
International markets were relatively quiet after their gains in the first half of the year. Developed and emerging market stocks each finished the quarter within 1% of where they started, with developed modestly outperforming emerging. Both international regions are up year-to-date despite ending the quarter flat and are still outperforming the S&P 500 over the past 12 months.
The quarter ultimately produced a mixed picture beneath the major indexes. The S&P 500 finished higher and reached a new all-time high, while smaller companies and several rate-sensitive areas traded lower as Treasury yields rose later in the quarter. The divergence of returns left market leadership narrower than it was in August, with major U.S. equity indexes still higher year-to-date.
Credit Market Recap – Rising Interest Rates Weigh on Bond Prices and Fixed Income Portfolios
The third quarter was challenging for bonds as Treasury yields surged higher. Figure 4 graphs the change in yield across various maturities during Q3. It shows that yields increased at each maturity, with the 5-year, 7-year, and 10-year Treasury yields each rising more than +0.80% and the 30-year yield increased nearly +0.70%. Longer-maturity bonds underperformed because of their higher sensitivity to changes in interest rates, while shorter-maturity Treasuries held up better on a relative basis despite trading lower.
Corporate bonds also came under pressure from the rise in Treasury yields, although they outperformed government bonds. High-yield produced a total return of -1.8% and outperformed investment-grade’s -3.7%, which was more impacted by rising rates due to its longer maturity. For most of the quarter, the primary headwind was rising interest rates rather than weakening credit conditions. Investment-grade and broad high-yield spreads remained relatively stable and tight by historical standards, suggesting investors were still comfortable with corporate fundamentals even as borrowing costs increased.
The clearest sign of caution appeared at the lowest-quality end of the high-yield bond market. Spreads on CCC-rated bonds, which are the lowest-rated high-yield bonds, widened even as spreads on higher-quality high-yield bonds held steady. The trend indicates investors started demanding more compensation to hold the debt of financially weaker borrowers. While broader high-yield spreads were comparatively calm for most of Q3, they also started to widen in late September. The move suggests the market became more selective as the quarter progressed, with the impact of higher financing costs showing up first among the most sensitive borrowers.
Q3’s bond-market weakness was driven mainly by rising Treasury yields rather than a broad deterioration in corporate credit. High-yield spreads widened late in the quarter, particularly among the lowest-quality borrowers, but investment-grade and broader high-yield spreads remained relatively contained. The distinction suggests higher financing costs were creating pressure in pockets of the market rather than across the full credit market.
2026 Outlook – What to Watch in Q4
Economic growth and corporate earnings remain strong heading into Q4, even as higher oil prices and interest rates have created a mixed and volatile backdrop. One of the main questions heading into Q4 is whether the underlying strength continues as households and businesses adjust to higher borrowing costs, persistent inflation pressure, and continued uncertainty around energy prices.
The economy has handled those pressures relatively well thus far. Consumers have continued to spend, businesses have kept investing, and unemployment has remained low. Those trends have helped support economic growth even as interest rates and borrowing costs have risen. The coming months will provide a clearer read on whether the momentum continues, particularly economic data that tracks consumer spending, hiring, and business investment.
Corporate earnings will be another important source of information. Profit growth has been strong over the past year and provided fundamental support to the market amidst a volatile macro backdrop. Q3 earnings season, which begins in October, will provide an updated look at how companies are managing higher interest rates, changing input costs, and continued investment while maintaining revenue and profit growth.
The AI investment cycle will remain an important part of the discussion as well. Spending on data centers, computing equipment, and related infrastructure continues to support business investment, while large technology companies are increasingly using the bond market to help finance the buildout. As the cycle matures, the focus is likely to broaden from how much is being spent to what that investment is producing in revenue, profits, and productivity.
Markets have absorbed several changes this year without losing their underlying support from economic growth and corporate earnings. We will continue watching how these trends develop while keeping the focus on portfolio diversification, discipline, and meeting your long-term financial goals across a range of possible outcomes.
A Truly Unique Wealth Management Experience
Let’s create a financial plan and investment strategy that allows you to live the life of your dreams. Schedule your free consultation today to explore tailored financial strategies designed to secure your future!
THIS QUARTER IN NUMBERS
Market and Economic Data Disclosures
The information and opinions provided herein are provided as general market commentary only and are subject to change at any time without notice. This commentary may contain forward-looking statements that are subject to various risks and uncertainties. None of the events or outcomes mentioned here may come to pass, and actual results may differ materially from those expressed or implied in these statements. No mention of a particular security, index, or other instrument in this report constitutes a recommendation to buy, sell, or hold that or any other security, nor does it constitute an opinion on the suitability of any security or index. The report is strictly an informational publication and has been prepared without regard to the particular investments and circumstances of the recipient.
Past performance does not guarantee or indicate future results. Any index performance mentioned is for illustrative purposes only and does not reflect any management fees, transaction costs, or expenses. Indexes are unmanaged, and one cannot invest directly in an index. Index performance does not represent the actual performance that would be achieved by investing in a fund.
Stock performance and fundamental data is based on the following instruments: SPDR S&P 500 ETF (SPY), SPDR Dow Jones ETF (DIA), iShares Russell 2000 ETF (IWM), iShares Russell 1000 Growth ETF (IWF), iShares Russell 1000 Value ETF (IWD), iShares MSCI EAFE ETF (EFA), iShares MSCI Emerging Markets ETF (EEM), Invesco QQQ Trust (QQQ).
Fixed Income performance is based on the following instruments: iShares Core U.S. Aggregate Bond ETF (AGG), iShares Investment Grade Corporate ETF (LQD), iShares National Muni Bond ETF (MUB), iShares High Yield Corporate ETF (HYG).
Fixed Income yields and key rates are based on the following instruments: Bloomberg US Aggregate, ICE BofA US Corporate, ICE BofA US Municipal Securities, ICE BofA US High Yield, 2 Year US Benchmark Bond, 10 Year US Benchmark Bond, 30 Year US Benchmark Bond, 30 Year US Fixed Mortgage Rate, US Prime Rate.
Commodity prices are based on the following instruments: Crude Oil WTI (NYM $/bbl), Gasoline Regular U.S. Gulf Coast ($/gal), Natural Gas (NYM $/mmbtu), Propane (NYM $/gal), Ethanol (CRB $/gallon), Gold (NYM $/ozt), Silver (NYM $/ozt), Copper NYMEX ($/lb), U.S. Midwest Domestic Hot-Rolled Coil Steel (NYM $/st), Corn (CBT $/bu), Soybeans (Chicago $/bu).
U.S. Style performance is based on the following instruments: iShares Russell 1000 Value ETF (IWD), SPDR S&P 500 ETF Trust (SPY), iShares Russell 1000 Growth ETF (IWF), iShares Russell Mid-Cap Value ETF (IWS), iShares Russell Midcap ETF (IWR), iShares Russell MidCap Growth ETF (IWP), iShares Russell 2000 Value ETF (IWN), iShares Russell 2000 ETF (IWM), iShares Russell 2000 Growth ETF (IWO).
U.S. Sector performance is based on the following instruments: Consumer Discretionary Sector SPDR ETF (XLY), Consumer Staples Sector SPDR ETF (XLP), Energy Sector SPDR ETF (XLE), Financial Sector SPDR ETF (XLF), Health Care Sector SPDR ETF (XLV), Industrial Sector SPDR ETF (XLI), Materials Sector SPDR ETF (XLB), Technology Sector SPDR ETF (XLK), Communication Services Sector SPDR ETF (XLC), Utilities Sector SPDR ETF (XLU), Real Estate Sector SPDR ETF (XLRE).
Concerns or questions about how your investment portfolio will hold up in the current market environment? Contact Financial Synergies today.
We are a boutique, financial advisory and total wealth management firm with over 35 years helping clients navigate turbulent markets. To learn more about our approach to investment management please reach out to us. One of our seasoned advisors would be happy to help you build a custom financial plan to help ensure you accomplish your financial goals and objectives. Schedule a conversation with us today.
More relevant articles by Financial Synergies:
Blog Disclosures
This content, which may contain security-related opinions and/or information, is provided for informational purposes only and should not be relied upon in any manner as professional advice, or an endorsement of any practices, products or services. There can be no guarantees or assurances that the views expressed here will be applicable for any particular facts or circumstances, and should not be relied upon in any manner. You should consult your own financial advisors as to legal, business, tax, and other related matters concerning any investment.
The commentary in this “post” (including any related blogs, videos, and social media) reflects the personal opinions, viewpoints, and analyses of the Financial Synergies Wealth Advisors, Inc. employees providing such comments, and should not be regarded as the views of Financial Synergies Wealth Advisors, Inc. or its respective affiliates or as a description of advisory services provided by Financial Synergies Wealth Advisors, Inc. or performance returns of any Financial Synergies Wealth Advisors, Inc. client.
Any opinions expressed herein do not constitute or imply endorsement, sponsorship, or recommendation by Financial Synergies Wealth Advisors, Inc. or its employees. The views reflected in the commentary are subject to change at any time without notice.
Nothing on this website or Blog constitutes investment or financial planning advice, performance data or any recommendation that any particular security, portfolio of securities, transaction or investment strategy is suitable for any specific person. It also should not be construed as an offer soliciting the purchase or sale of any security mentioned. Nor should it be construed as an offer to provide investment advisory services by Financial Synergies Wealth Advisors, Inc.
Any mention of a particular security and related performance data is not a recommendation to buy or sell that security. Financial Synergies Wealth Advisors, Inc. manages its clients’ accounts using a variety of investment techniques and strategies, which are not necessarily discussed in the commentary. Investments in securities involve the risk of loss. Past performance is no guarantee of future results.
Any charts provided here or on any related Financial Synergies Wealth Advisors, Inc. personnel content outlets are for informational purposes only, and should also not be relied upon when making any investment decision. Any indices referenced for comparison are unmanaged and cannot be invested into directly. As always please remember investing involves risk and possible loss of principal capital; please seek advice from a licensed professional. Any projections, estimates, forecasts, targets, prospects and/or opinions expressed in these materials are subject to change without notice and may differ or be contrary to opinions expressed by others. Information in charts have been obtained from third-party sources and data, and may include those from portfolio securities of funds managed by Financial Synergies Wealth Advisors, Inc. While taken from sources believed to be reliable, Financial Synergies Wealth Advisors, Inc. has not independently verified such information and makes no representations about the enduring accuracy of the information or its appropriateness for a given situation. All content speaks only as of the date indicated.
Financial Synergies Wealth Advisors, Inc. is a registered investment adviser. Advisory services are only offered to clients or prospective clients where Financial Synergies Wealth Advisors, Inc. and its representatives are properly licensed or exempt from licensure. Investments in securities involve the risk of loss. Past performance is no guarantee of future results.
See Full Disclosures Page Here
Recent Posts
3rd Quarter 2026 Market and Economic Review
Weekly Market Recap – Q2 GDP Growth, Consumer Spending, AI Capex, & Rising Treasury Yields
Retirement Income Risks: Planning for a Longer Life
Subscribe to Our Blog
Chief Investment Officer | Managing Partner