Investors often use major indices like the S&P 500, Nasdaq Composite, and Dow Jones Industrial Average as a way to understand how financial markets are performing. While this is a helpful place to start in a closer look at the stock market, the reality is that the stock market is made up of many thousands of companies, each affected by economic and market trends in unique ways.
To understand these trends, stocks are often grouped into sectors, geography, and other characteristics such as the size of the company or the style of investment. Each of these groups can play an important role in long-term portfolios.
While headlines about the S&P 500 reaching new highs or the Nasdaq being driven by artificial intelligence can make it seem as though all stocks are moving together, there is often much more happening beneath the surface. This is especially relevant today because many of the drivers, including AI, oil prices, interest rates, and tariffs, affect all parts of the market, not just large-cap stocks. Understanding these drivers can help investors stay balanced and position their portfolios for long-term goals.
Today, areas of the market including small-caps, value stocks, and international companies have outperformed over the past year, and their valuations have generally been more attractive. Understanding how sizes and styles have performed can help investors maintain balance. What is happening beneath the surface of the broad market indices, and what does it mean for investors?
Different sizes and styles are affected by market conditions in unique ways
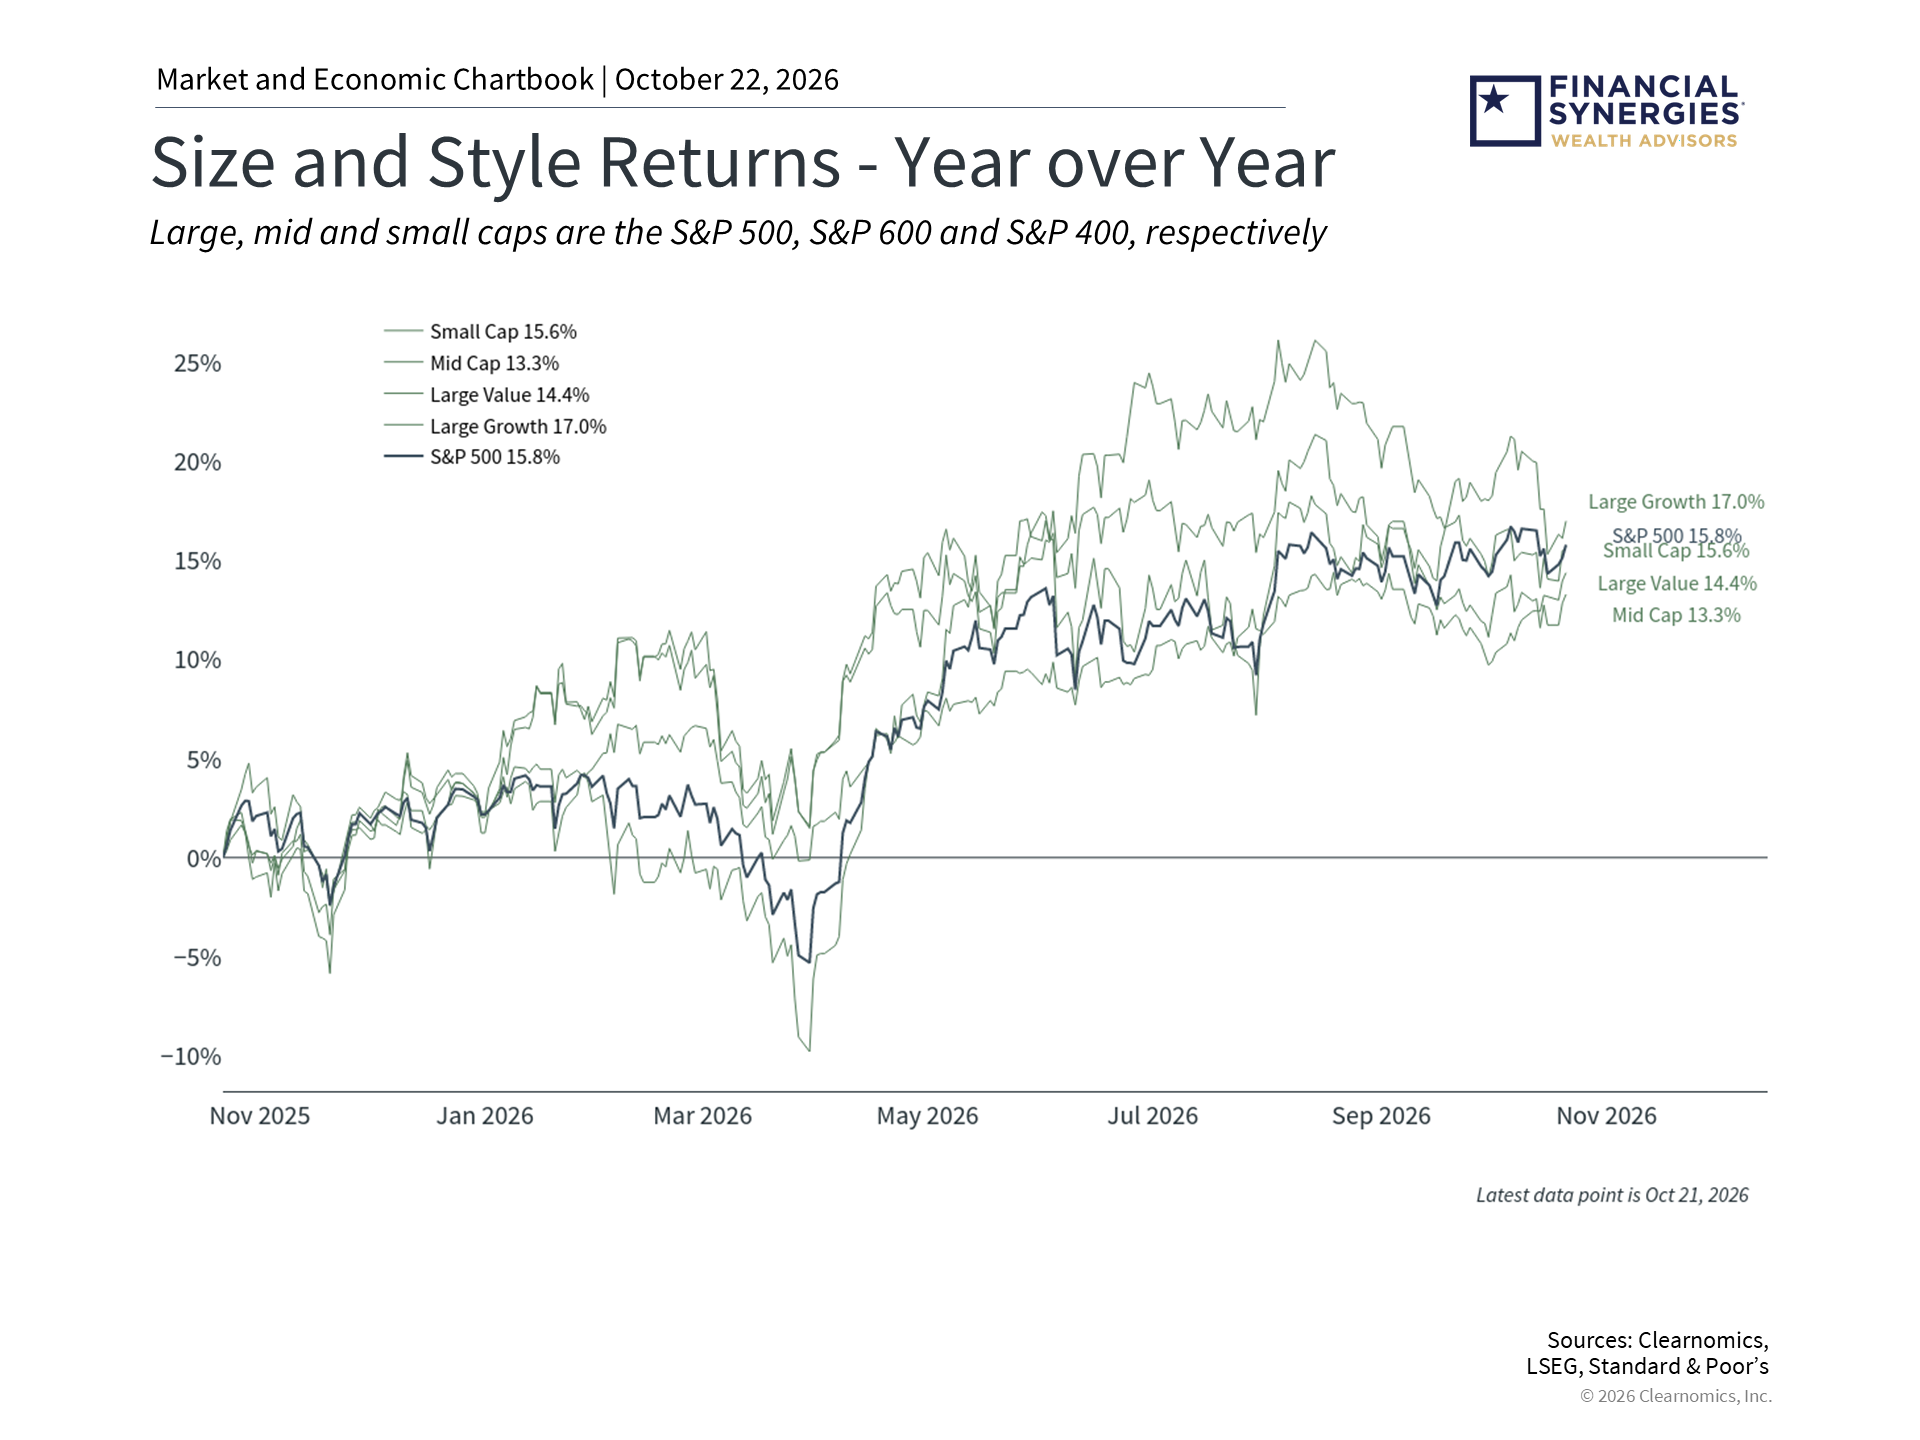
While the overall market has experienced double-digit returns this year, at least two important trends have been taking place beneath the surface.1 First, value stocks have outperformed over the past year, a reversal of the trend since 2022 when growth stocks generated strong returns due to technology and AI investments.2
The distinction between value and growth is an important one for investors, and has been the source of much academic research over the past 50 years.3 Value is often defined as companies with attractive valuation ratios, since their prices are low relative to fundamentals such as earnings or sales. Growth, on the other hand, refers to those stocks with higher valuations that reflect expected increases in earnings and market share, and often represents trends that investors are enthusiastic about. The specific companies these represent can change over time, such as dot-com stocks in the late 1990s and AI stocks today.
Value stocks have outperformed this year for many reasons, including uncertainty around interest rates and the outperformance of the Energy sector due to high oil prices.4 Interest rates are near multi-decade highs, which tends to affect growth stocks more. This is because their prices are based on future growth, and higher interest rates reduce the value of future cash flows.
Second, small-cap stocks have outperformed large-cap stocks this year, reversing a general trend that lasted well over a decade. In fact, prior to this year, small-cap stocks had underperformed the S&P 500 since 2020.5
Small-caps have been strong this year for many of the same reasons as the rest of the market. AI, for instance, is often viewed as a large-cap opportunity, but many smaller industrial and technology companies supply the equipment, components, and services needed to build data centers and other infrastructure. As a result, these businesses are experiencing healthy revenue and earnings growth today that rivals many other parts of the market.
One challenge is that small-caps are often more sensitive to interest rates since they have less access to financing than large-cap companies. This has created uncertainty across this group more recently as long-term rates remain high and the possibility of Fed rate hikes increases. However, history shows that this is not always the case. Two of the strongest periods for small-cap relative performance occurred in the late 1970s and the mid 2000s, both of which featured higher interest rates and inflation.6 There are many reasons for this, such as the fact that smaller businesses can sometimes raise prices more easily, boosting their operating margins.
Valuations matter for long-term investing
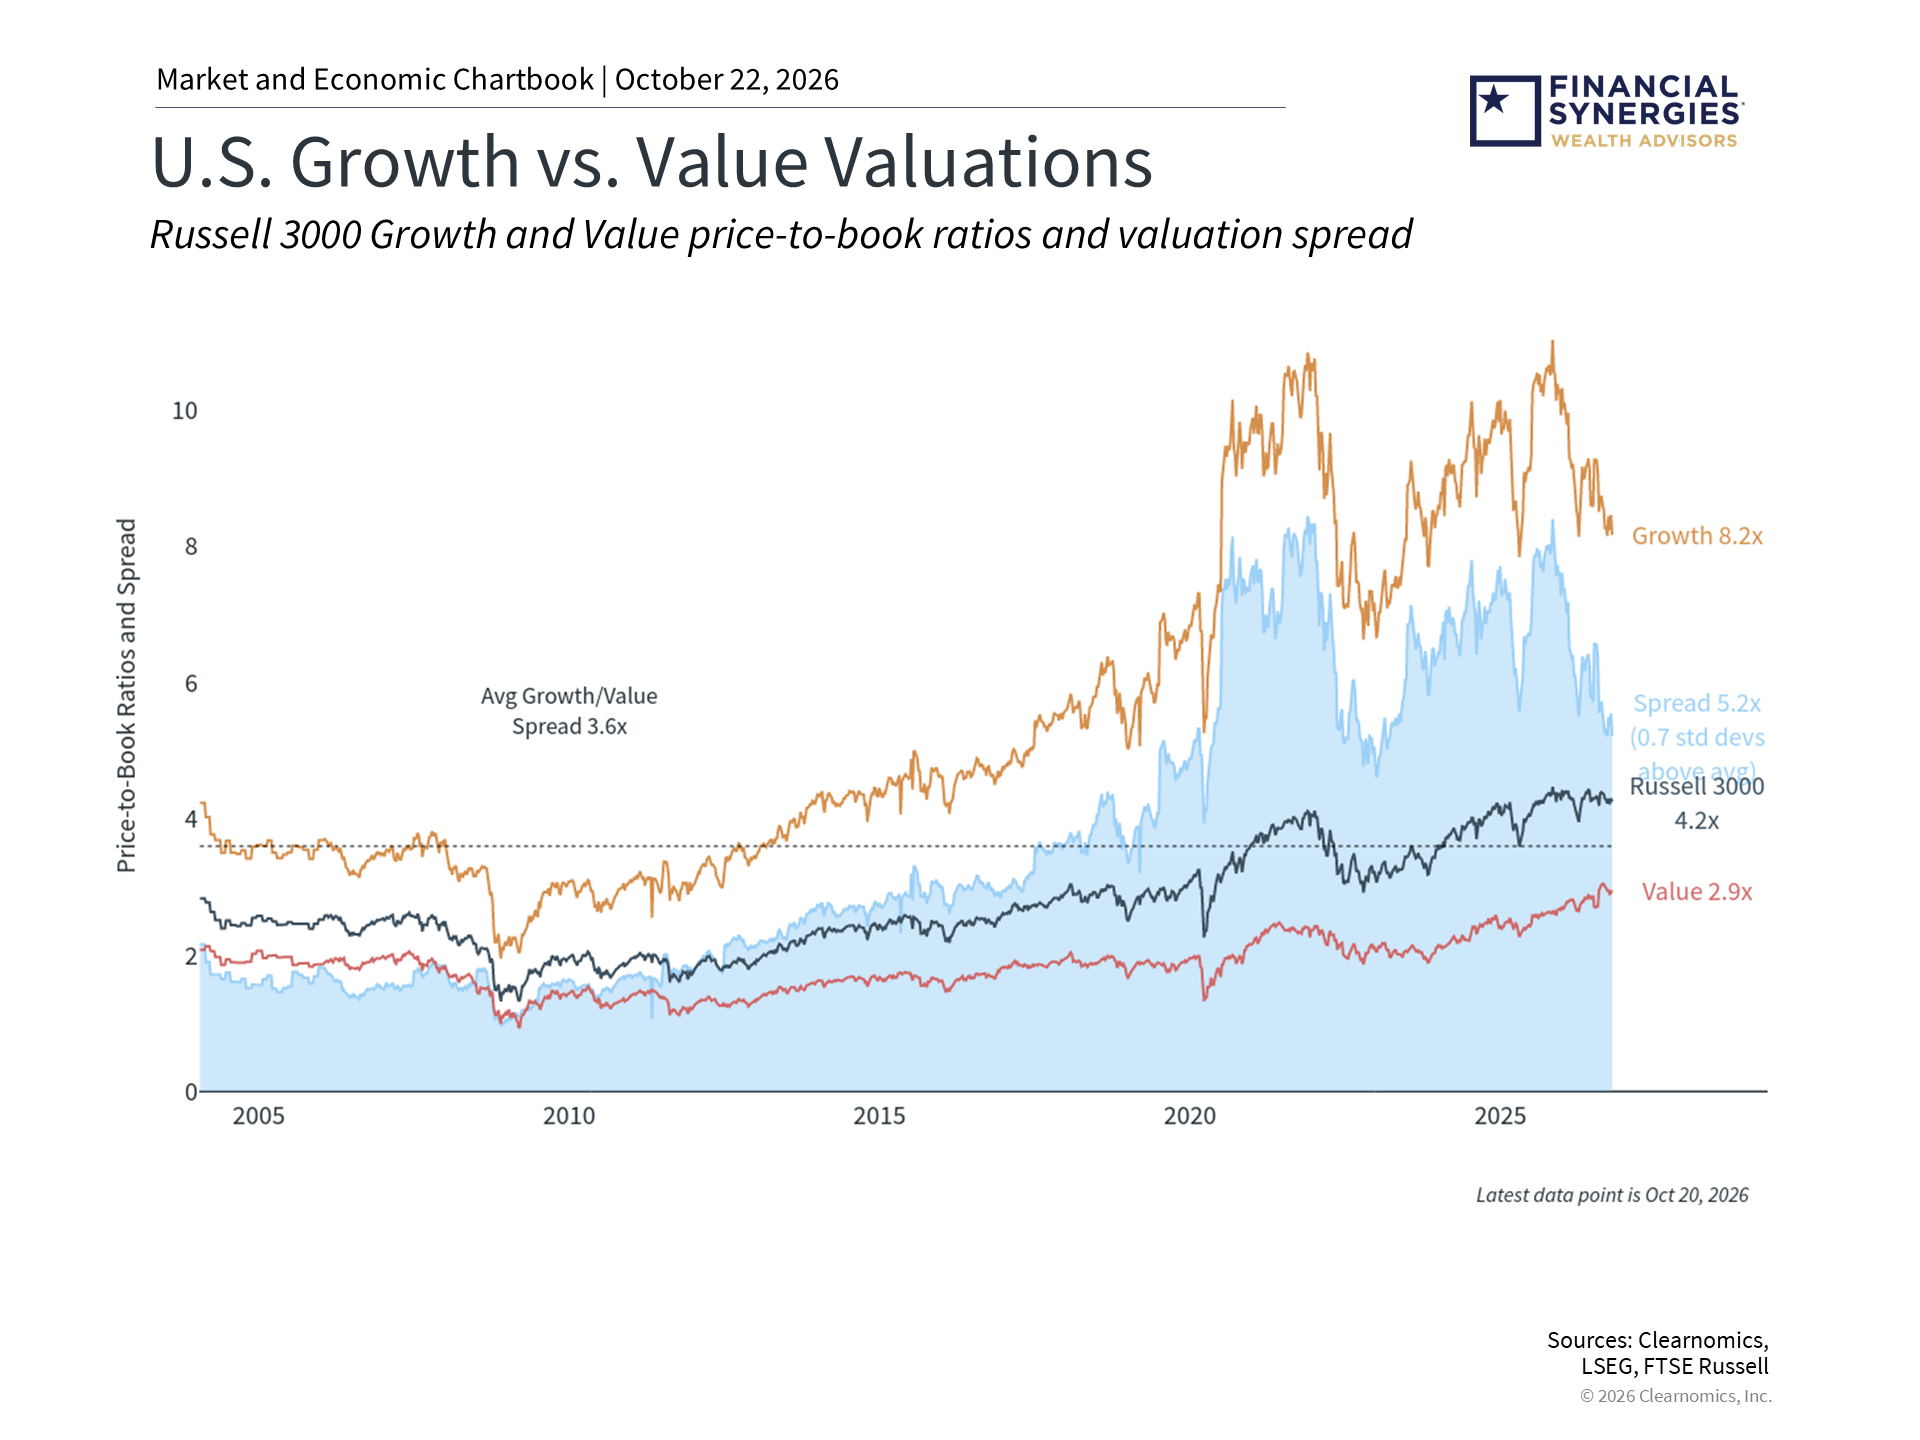
The importance of different stock market styles is not just about past returns, but about valuations as well. In the long run, lower valuations have historically supported forward returns, so it’s important to consider all parts of the market.
The stock market is often said to experience “regimes,” or periods when certain investment styles outperform. These regimes can last months, years, or even decades. Perhaps the most studied is the fact that value stocks led for much of the 20th century until growth took over during the dot-com era.
The accompanying chart shows the difference between growth and value valuations using the price-to-book ratio. Growth stocks, particularly the largest technology companies, are hovering near historically high valuations.7 By comparison, value stocks and smaller companies are more attractively priced. As always, past performance does not guarantee future results, so these valuation differences do not ensure that value or small-caps will continue to outperform. However, it does help explain why market leadership has shifted, and why investors should consider different parts of the market in their portfolios.
The important lesson is not to try to time these shifts, but to recognize that no single trend lasts forever. This is why holding an appropriate balance across styles and sizes, rather than chasing what has recently worked, has served investors well over history.
International markets are another source of diversification
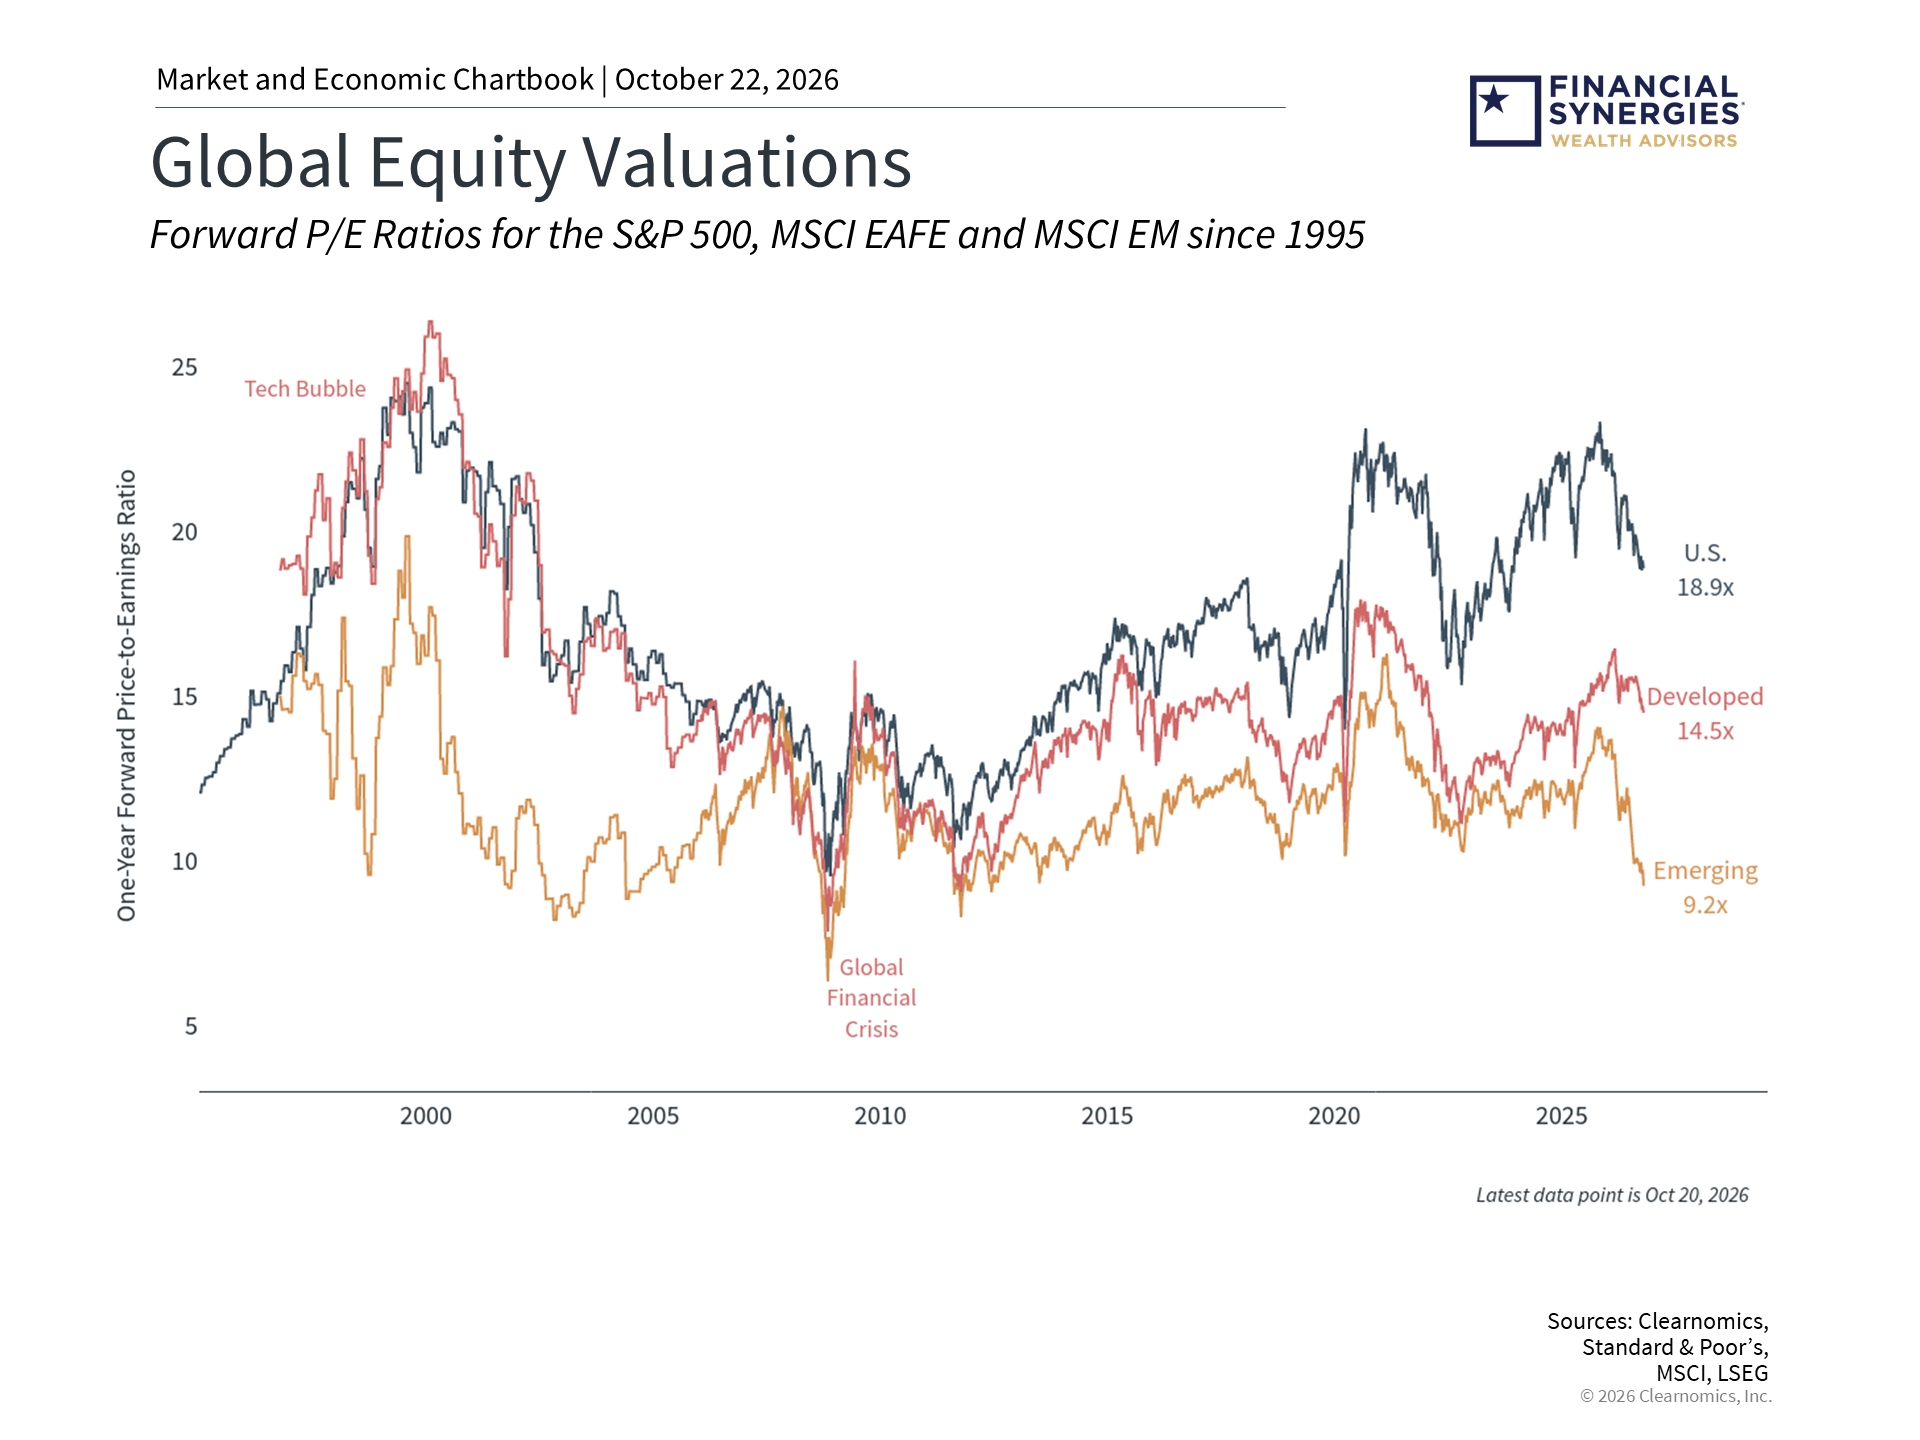
The same reasoning that applies within the U.S. market also applies across geographies. Just as different sizes and styles respond differently to economic trends, so too do markets around the world. This is why international diversification can be an important tool for long-term investors.
Emerging market stocks, for instance, have performed well this year as earnings growth expectations have improved and valuations have become more attractive.8 The accompanying chart shows that valuations for emerging market and developed market stocks remain well below those of the U.S. across many measures. While U.S. stocks outperformed for much of the past decade, returns since the beginning of last year show that this can change unexpectedly.
Of course, international investing carries its own set of risks, including geopolitical, currency, and regulatory considerations. These risks are precisely why international stocks behave differently than U.S. stocks over time. That said, many U.S. multinational companies also have high international revenues, which naturally offer geographic diversification. When combined thoughtfully with domestic holdings, they can improve the balance of a portfolio.
Ultimately, which parts of the market fit into a portfolio depends on each investor’s specific needs, goals, and risk tolerance. The point is not to predict whether small caps will continue to lead or whether value stocks will keep outperforming. Instead, it’s important to recognize that the stock market is far broader than the handful of companies that dominate the headlines.
The bottom line? While it’s helpful to start with major indices when investing, not all parts of the market behave the same way. Staying balanced across sizes, styles, and geographies is an important way for investors to build a portfolio aligned with long-term financial goals.
References
1. S&P 500 Index as of September 11, 2026
2. Clearnomics research and the Russell 3000 Value and Growth indexes, as of September 11, 2026
3. Fama and French, 1992, “The Cross-Section of Expected Stock Returns,” https://www.jstor.org/stable/2329112
4. Clearnomics research, LSEG and FTSE Russell, as of September 11, 2026
5. Clearnomics research and the Russell 2000 Index, as of September 11, 2026
6. Banz, 1981, “The Relationship Between Return and Market Value of Common Stock,” https://www.sciencedirect.com/science/article/abs/pii/0304405X81900180
7. Clearnomics research, LSEG and FTSE Russell, as of September 11, 2026
8. Clearnomics research and the MSCI Emerging Markets Index, as of September 11, 2026
Concerns or questions about how your investment portfolio will hold up in the current market environment? Contact Financial Synergies today.
We are a boutique financial advisory and total wealth management firm with over 35 years of helping clients navigate turbulent markets. To learn more about our approach to investment management and financial planning, please reach out to us. One of our seasoned advisors would be happy to help you build a custom financial plan to help ensure you accomplish your financial goals and objectives. Schedule a conversation with us today.
More relevant articles by Financial Synergies Wealth Advisors:
Blog Disclosures
This content, which contains security-related opinions and/or information, is provided for informational purposes only and should not be relied upon in any manner as professional advice, or an endorsement of any practices, products or services. There can be no guarantees or assurances that the views expressed here will be applicable for any particular facts or circumstances, and should not be relied upon in any manner. You should consult your own financial advisors as to legal, business, tax, and other related matters concerning any investment.
The commentary in this “post” (including any related blogs, videos, and social media) reflects the personal opinions, viewpoints, and analyses of the Financial Synergies Wealth Advisors, Inc. employees providing such comments, and should not be regarded as the views of Financial Synergies Wealth Advisors, Inc. or its respective affiliates or as a description of advisory services provided by Financial Synergies Wealth Advisors, Inc. or performance returns of any Financial Synergies Wealth Advisors, Inc. client.
Any opinions expressed herein do not constitute or imply endorsement, sponsorship, or recommendation by Financial Synergies Wealth Advisors, Inc. or its employees. The views reflected in the commentary are subject to change at any time without notice.
Nothing on this website constitutes investment or financial planning advice, performance data or any recommendation that any particular security, portfolio of securities, transaction or investment strategy is suitable for any specific person. It also should not be construed as an offer soliciting the purchase or sale of any security mentioned. Nor should it be construed as an offer to provide investment advisory services by Financial Synergies Wealth Advisors, Inc.
Any mention of a particular security and related performance data is not a recommendation to buy or sell that security. Financial Synergies Wealth Advisors, Inc. manages its clients’ accounts using a variety of investment techniques and strategies, which are not necessarily discussed in the commentary. Investments in securities involve the risk of loss. Past performance is no guarantee of future results.
Any charts provided here or on any related Financial Synergies Wealth Advisors, Inc. personnel content outlets are for informational purposes only, and should also not be relied upon when making any investment decision. Any indices referenced for comparison are unmanaged and cannot be invested into directly. As always please remember investing involves risk and possible loss of principal capital; please seek advice from a licensed professional. Any projections, estimates, forecasts, targets, prospects and/or opinions expressed in these materials are subject to change without notice and may differ or be contrary to opinions expressed by others. Information in charts have been obtained from third-party sources and data, and may include those from portfolio securities of funds managed by Financial Synergies Wealth Advisors, Inc. While taken from sources believed to be reliable, Financial Synergies Wealth Advisors, Inc. has not independently verified such information and makes no representations about the enduring accuracy of the information or its appropriateness for a given situation. All content speaks only as of the date indicated.
Financial Synergies Wealth Advisors, Inc. is a registered investment adviser. Advisory services are only offered to clients or prospective clients where Financial Synergies Wealth Advisors, Inc. and its representatives are properly licensed or exempt from licensure. Investments in securities involve the risk of loss. Past performance is no guarantee of future results.
See Full Disclosures Page Here
 Skip to content


A Closer Look at the Stock Market: Style, Size, and Regions
Investors often use major indices like the S&P 500, Nasdaq Composite, and Dow Jones Industrial Average as a way to understand how financial markets are performing. While this is a helpful place to start in a closer look at the stock market, the reality is that the stock market is made up of many thousands of companies, each affected by economic and market trends in unique ways.
To understand these trends, stocks are often grouped into sectors, geography, and other characteristics such as the size of the company or the style of investment. Each of these groups can play an important role in long-term portfolios.
While headlines about the S&P 500 reaching new highs or the Nasdaq being driven by artificial intelligence can make it seem as though all stocks are moving together, there is often much more happening beneath the surface. This is especially relevant today because many of the drivers, including AI, oil prices, interest rates, and tariffs, affect all parts of the market, not just large-cap stocks. Understanding these drivers can help investors stay balanced and position their portfolios for long-term goals.
Today, areas of the market including small-caps, value stocks, and international companies have outperformed over the past year, and their valuations have generally been more attractive. Understanding how sizes and styles have performed can help investors maintain balance. What is happening beneath the surface of the broad market indices, and what does it mean for investors?
Different sizes and styles are affected by market conditions in unique ways
While the overall market has experienced double-digit returns this year, at least two important trends have been taking place beneath the surface.1 First, value stocks have outperformed over the past year, a reversal of the trend since 2022 when growth stocks generated strong returns due to technology and AI investments.2
The distinction between value and growth is an important one for investors, and has been the source of much academic research over the past 50 years.3 Value is often defined as companies with attractive valuation ratios, since their prices are low relative to fundamentals such as earnings or sales. Growth, on the other hand, refers to those stocks with higher valuations that reflect expected increases in earnings and market share, and often represents trends that investors are enthusiastic about. The specific companies these represent can change over time, such as dot-com stocks in the late 1990s and AI stocks today.
Value stocks have outperformed this year for many reasons, including uncertainty around interest rates and the outperformance of the Energy sector due to high oil prices.4 Interest rates are near multi-decade highs, which tends to affect growth stocks more. This is because their prices are based on future growth, and higher interest rates reduce the value of future cash flows.
Second, small-cap stocks have outperformed large-cap stocks this year, reversing a general trend that lasted well over a decade. In fact, prior to this year, small-cap stocks had underperformed the S&P 500 since 2020.5
Small-caps have been strong this year for many of the same reasons as the rest of the market. AI, for instance, is often viewed as a large-cap opportunity, but many smaller industrial and technology companies supply the equipment, components, and services needed to build data centers and other infrastructure. As a result, these businesses are experiencing healthy revenue and earnings growth today that rivals many other parts of the market.
One challenge is that small-caps are often more sensitive to interest rates since they have less access to financing than large-cap companies. This has created uncertainty across this group more recently as long-term rates remain high and the possibility of Fed rate hikes increases. However, history shows that this is not always the case. Two of the strongest periods for small-cap relative performance occurred in the late 1970s and the mid 2000s, both of which featured higher interest rates and inflation.6 There are many reasons for this, such as the fact that smaller businesses can sometimes raise prices more easily, boosting their operating margins.
Valuations matter for long-term investing
The importance of different stock market styles is not just about past returns, but about valuations as well. In the long run, lower valuations have historically supported forward returns, so it’s important to consider all parts of the market.
The stock market is often said to experience “regimes,” or periods when certain investment styles outperform. These regimes can last months, years, or even decades. Perhaps the most studied is the fact that value stocks led for much of the 20th century until growth took over during the dot-com era.
The accompanying chart shows the difference between growth and value valuations using the price-to-book ratio. Growth stocks, particularly the largest technology companies, are hovering near historically high valuations.7 By comparison, value stocks and smaller companies are more attractively priced. As always, past performance does not guarantee future results, so these valuation differences do not ensure that value or small-caps will continue to outperform. However, it does help explain why market leadership has shifted, and why investors should consider different parts of the market in their portfolios.
The important lesson is not to try to time these shifts, but to recognize that no single trend lasts forever. This is why holding an appropriate balance across styles and sizes, rather than chasing what has recently worked, has served investors well over history.
International markets are another source of diversification
The same reasoning that applies within the U.S. market also applies across geographies. Just as different sizes and styles respond differently to economic trends, so too do markets around the world. This is why international diversification can be an important tool for long-term investors.
Emerging market stocks, for instance, have performed well this year as earnings growth expectations have improved and valuations have become more attractive.8 The accompanying chart shows that valuations for emerging market and developed market stocks remain well below those of the U.S. across many measures. While U.S. stocks outperformed for much of the past decade, returns since the beginning of last year show that this can change unexpectedly.
Of course, international investing carries its own set of risks, including geopolitical, currency, and regulatory considerations. These risks are precisely why international stocks behave differently than U.S. stocks over time. That said, many U.S. multinational companies also have high international revenues, which naturally offer geographic diversification. When combined thoughtfully with domestic holdings, they can improve the balance of a portfolio.
Ultimately, which parts of the market fit into a portfolio depends on each investor’s specific needs, goals, and risk tolerance. The point is not to predict whether small caps will continue to lead or whether value stocks will keep outperforming. Instead, it’s important to recognize that the stock market is far broader than the handful of companies that dominate the headlines.
The bottom line? While it’s helpful to start with major indices when investing, not all parts of the market behave the same way. Staying balanced across sizes, styles, and geographies is an important way for investors to build a portfolio aligned with long-term financial goals.
References
1. S&P 500 Index as of September 11, 2026
2. Clearnomics research and the Russell 3000 Value and Growth indexes, as of September 11, 2026
3. Fama and French, 1992, “The Cross-Section of Expected Stock Returns,” https://www.jstor.org/stable/2329112
4. Clearnomics research, LSEG and FTSE Russell, as of September 11, 2026
5. Clearnomics research and the Russell 2000 Index, as of September 11, 2026
6. Banz, 1981, “The Relationship Between Return and Market Value of Common Stock,” https://www.sciencedirect.com/science/article/abs/pii/0304405X81900180
7. Clearnomics research, LSEG and FTSE Russell, as of September 11, 2026
8. Clearnomics research and the MSCI Emerging Markets Index, as of September 11, 2026
Concerns or questions about how your investment portfolio will hold up in the current market environment? Contact Financial Synergies today.
We are a boutique financial advisory and total wealth management firm with over 35 years of helping clients navigate turbulent markets. To learn more about our approach to investment management and financial planning, please reach out to us. One of our seasoned advisors would be happy to help you build a custom financial plan to help ensure you accomplish your financial goals and objectives. Schedule a conversation with us today.
More relevant articles by Financial Synergies Wealth Advisors:
Blog Disclosures
This content, which contains security-related opinions and/or information, is provided for informational purposes only and should not be relied upon in any manner as professional advice, or an endorsement of any practices, products or services. There can be no guarantees or assurances that the views expressed here will be applicable for any particular facts or circumstances, and should not be relied upon in any manner. You should consult your own financial advisors as to legal, business, tax, and other related matters concerning any investment.
The commentary in this “post” (including any related blogs, videos, and social media) reflects the personal opinions, viewpoints, and analyses of the Financial Synergies Wealth Advisors, Inc. employees providing such comments, and should not be regarded as the views of Financial Synergies Wealth Advisors, Inc. or its respective affiliates or as a description of advisory services provided by Financial Synergies Wealth Advisors, Inc. or performance returns of any Financial Synergies Wealth Advisors, Inc. client.
Any opinions expressed herein do not constitute or imply endorsement, sponsorship, or recommendation by Financial Synergies Wealth Advisors, Inc. or its employees. The views reflected in the commentary are subject to change at any time without notice.
Nothing on this website constitutes investment or financial planning advice, performance data or any recommendation that any particular security, portfolio of securities, transaction or investment strategy is suitable for any specific person. It also should not be construed as an offer soliciting the purchase or sale of any security mentioned. Nor should it be construed as an offer to provide investment advisory services by Financial Synergies Wealth Advisors, Inc.
Any mention of a particular security and related performance data is not a recommendation to buy or sell that security. Financial Synergies Wealth Advisors, Inc. manages its clients’ accounts using a variety of investment techniques and strategies, which are not necessarily discussed in the commentary. Investments in securities involve the risk of loss. Past performance is no guarantee of future results.
Any charts provided here or on any related Financial Synergies Wealth Advisors, Inc. personnel content outlets are for informational purposes only, and should also not be relied upon when making any investment decision. Any indices referenced for comparison are unmanaged and cannot be invested into directly. As always please remember investing involves risk and possible loss of principal capital; please seek advice from a licensed professional. Any projections, estimates, forecasts, targets, prospects and/or opinions expressed in these materials are subject to change without notice and may differ or be contrary to opinions expressed by others. Information in charts have been obtained from third-party sources and data, and may include those from portfolio securities of funds managed by Financial Synergies Wealth Advisors, Inc. While taken from sources believed to be reliable, Financial Synergies Wealth Advisors, Inc. has not independently verified such information and makes no representations about the enduring accuracy of the information or its appropriateness for a given situation. All content speaks only as of the date indicated.
Financial Synergies Wealth Advisors, Inc. is a registered investment adviser. Advisory services are only offered to clients or prospective clients where Financial Synergies Wealth Advisors, Inc. and its representatives are properly licensed or exempt from licensure. Investments in securities involve the risk of loss. Past performance is no guarantee of future results.
See Full Disclosures Page Here
Recent Posts
A Closer Look at the Stock Market: Style, Size, and Regions
Chart of the Month | Stocks vs. Bonds: More Choices for Investors as Bond Yields Rise
Weekly Market Recap – September Inflation & Retail Sales Data, AI Financing, & Bank Earnings
Subscribe to Our Blog
Chief Investment Officer | Managing Partner