4th Quarter 2025 Market and Economic Review
Key Updates on the Economy & Markets
Markets navigated a complex environment in Q4. The quarter started with a government shutdown, which lasted 43 days and delayed key economic data releases.
The lack of timely information made it difficult to assess the economy’s strength and contributed to periods of volatility as the market reacted to incomplete information. The Fed cut interest rates by -0.50% but signaled a pause, hinting that it could cut less than the market expects in 2026. Investors remain excited about the potential of artificial intelligence, but they’ve become more focused on which companies are best positioned to turn AI demand into near-term profits. Against this backdrop, the S&P 500, Nasdaq, and small-cap stocks each set new highs. In this letter, we recap Q4’s defining themes and events, review performance across key market areas, and look ahead to 2026.
If you would prefer to download a PDF copy of this report, one is provided here: 4th Quarter 2025 Market and Economic Review.
Government Shutdown Creates a Data Fog
The main story in Q4 was the government shutdown and its impact on economic visibility. The shutdown started on October 1st and immediately disrupted the release of key reports on employment, inflation, and growth. To fill the data gap, the market and economists turned to corporate earnings reports and surveys from non-government sources. The shutdown lasted through mid-November, making it the longest in history, and it left behind a data backlog that is still being cleared as the new year begins.
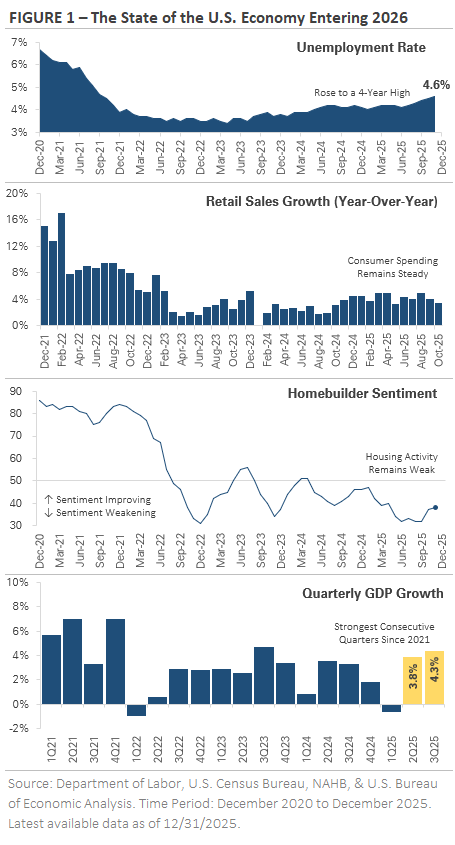 The stacked charts in Figure 1 provide an update on the economy using labor, consumer spending, and housing data released after the shutdown. The top chart shows labor market conditions continued to soften in Q4, with unemployment rising to a four-year high as hiring slowed. The second chart, which graphs the year-over-year growth rate of retail sales, highlights the consumer’s resilience. Consumer spending has cooled since 2022, but it remains steady despite affordability challenges and persistent inflation. The third chart graphs the homebuilder sentiment index, where readings above 50 signal positive sentiment. The index ticked higher in recent months, but it remains below 50, an indication that housing activity continues to run below the pre-pandemic trend. The bottom chart shows GDP growth rose to +4.3% in Q3, up from Q2’s +3.8%. Those are the strongest consecutive quarters of growth since 2021, before the Fed’s aggressive rate hiking cycle.
The data reveal a late-cycle economy that is slowing but not breaking. Labor market conditions are soft, consumer spending is slowing, and housing is under pressure, but the economy shows few signs of significant stress. The strong Q3 GDP reading indicates the economy reaccelerated after slowing in Q1, suggesting consumers and businesses altered their behavior in 2025 due to shifting trade policy and tariffs. Now that the trade policy uncertainty has eased, there’s a debate about where economic activity will settle in 2026. The uncertainty explains the Fed’s cautious tone and the market’s heightened sensitivity to new data.
Fed Cuts Twice but Signals a Pause in Early 2026
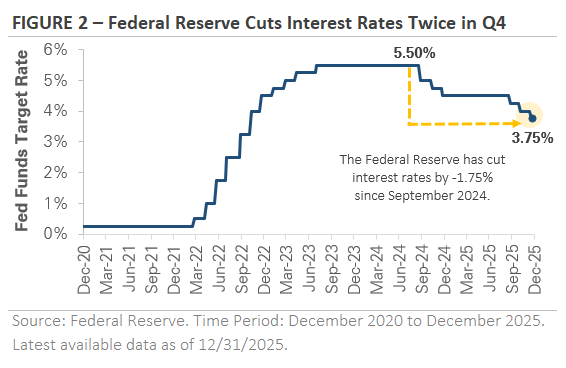
The Federal Reserve continued its rate-cutting cycle in Q4, but policymakers delivered a more nuanced message than simply lowering rates and offering forward guidance. Figure 2 shows the Fed has cut interest rates by a total of -1.75% since starting its rate-cutting cycle in September 2024. Two of those cuts came in Q4, with -0.25% reductions at the October and December meetings. However, the messaging behind the two cuts changed. Officials have grown more cautious and divided, with several voting members favoring either no cut or a larger cut, and they’ve emphasized that future rate cuts will depend on incoming data.
 Uncertainty around Fed policy led to wide swings in market expectations. Investors flipped between pricing in multiple rate cuts and a slower, cautious rate-cutting cycle. Fed officials themselves appeared divided, with some warning that policy remains too restrictive and risks slowing economic growth while others caution that cutting too soon could reignite inflation. The shutdown added to the confusion by delaying key economic data, making Fed policy a source of near-term uncertainty and market volatility.
The question is what happens next. By quarter-end, Fed officials made clear that the threshold for additional rate hikes is high, but they also stressed the need for flexibility and patience. The current backdrop is a mix of cooling inflation, a soft labor market, and a still-expanding economy. Looking at Figure 2, the setup is similar to late 2024, when the Fed cut multiple times before pausing for nine months. This time it’s the shutdown data fog making it difficult for the Fed to forecast policy. The Fed has signaled that it will pause in early 2026 and potentially cut fewer times than the market expects. The prospect of additional rate cuts and lower interest rates is supportive in principle, but the policy outlook is now more sensitive to incoming data. That sensitivity contributed to the Q4 stock market volatility, and it will likely remain a market driver in early 2026.
The AI Trade Becomes More Selective
Artificial intelligence remained a key investment theme in Q4, but the narrative matured. AI stocks entered the quarter with strong momentum, powered by robust earnings, a boom in data center construction, and a growing list of large-scale infrastructure investment projects. Investors were optimistic that AI capex would translate into growth and increased profitability, and many AI-related stocks benefited from broad enthusiasm toward the industry.
Midway through the quarter, the market’s focus shifted. Earnings reports continued to signal strong demand for AI-related computing power and data centers, and leading tech companies reported large, growing backlogs. However, investors started to look beyond headline growth and focus on AI’s economics. Questions emerged about the capital needed to build and maintain data centers, the impact of aggressive capex spending on balance sheets, and whether companies could maintain the current pace of AI infrastructure spending without pressuring cash flow.
The market became more selective. Companies involved in large-scale AI projects faced increased scrutiny, especially where spending plans outpaced near-term cash flow or relied on external financing like debt. Strong earnings and ambitious spending plans were no longer enough to push a company’s stock price higher, and sector leadership shifted toward firms demonstrating pricing power and a path to profitability. The changing AI narrative created periods of volatility and rotation within the tech sector, but it doesn’t necessarily mean the end of the AI trade. As with many transformative technologies, the initial excitement appears to be giving way to a focus on execution and profitability rather than broad enthusiasm and growth at any cost.
Equity Market Recap – Stock Market Ends the Year Near All-Time Highs
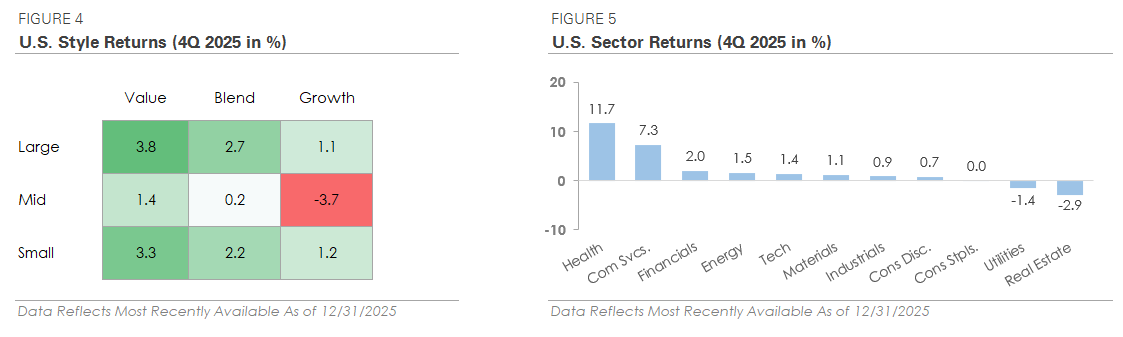
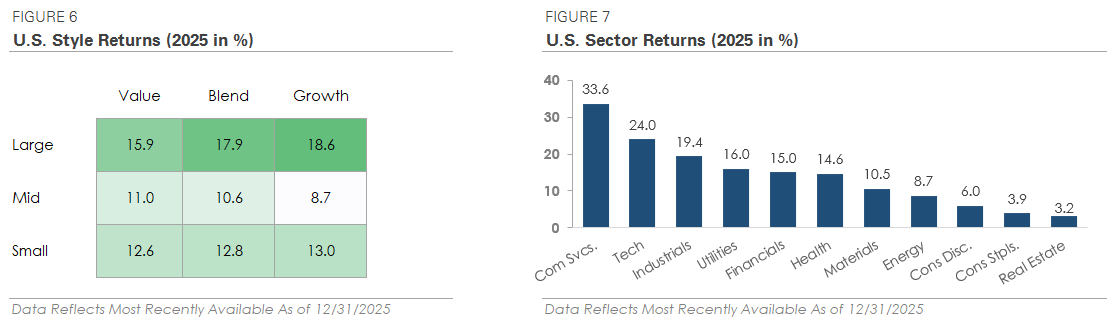
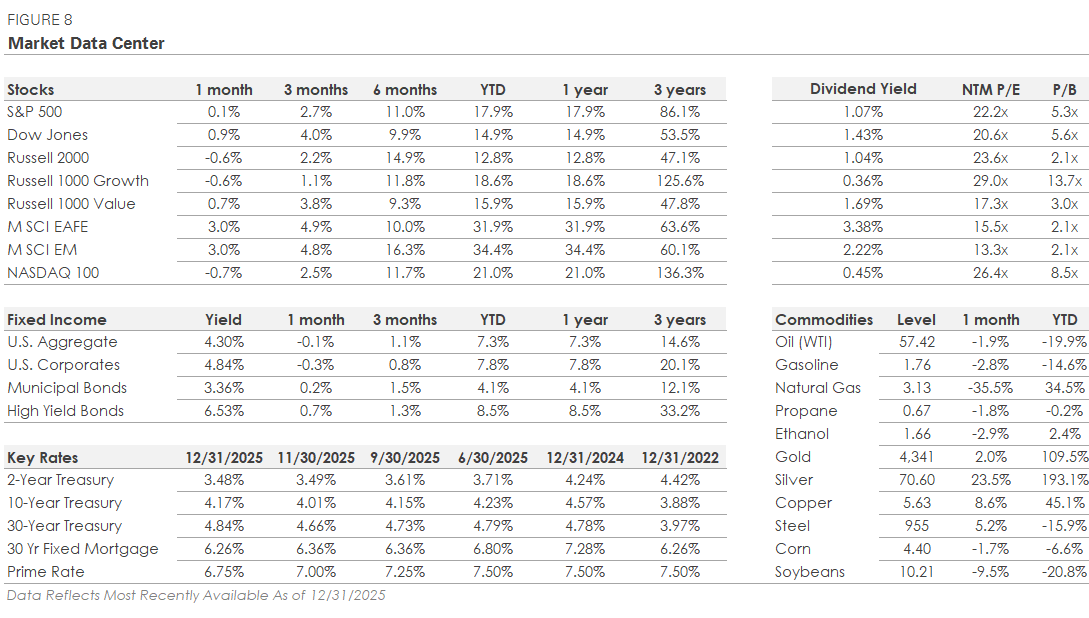
Stocks closed out the year with another quarter of gains, building on their momentum from earlier in the year. The S&P 500 gained +2.7% in Q4, bringing its year-to-date return to nearly +18%. The Nasdaq 100, an index of leading tech companies, gained +2.5%, raising its full-year return to +21%. Those headline returns were constructive, but the main development was a shift in market leadership. Large-cap value proxies led the market, with the Dow Jones Industrial Average and the Russell 1000 Value each gaining approximately +4.0%. The Russell 2000 gained +2.2%, with small-cap stocks rallying to new highs as the Fed cut twice.
Despite solid gains across the stock market, the pace of the rally continued to slow from the second and third quarters. Sector breadth also remained narrow, with only two S&P 500 sectors outperforming the broader index. Health care was the top-performing sector, benefiting from renewed interest amid increased AI scrutiny and a pause in tech leadership. The sector’s defensiveness and improved earnings stability were catalysts, but the quarter wasn’t defined by a flight to safety. The defensive trio of real estate, utilities, and consumer staples were the weakest sectors, signaling limited investor concern about the economy.
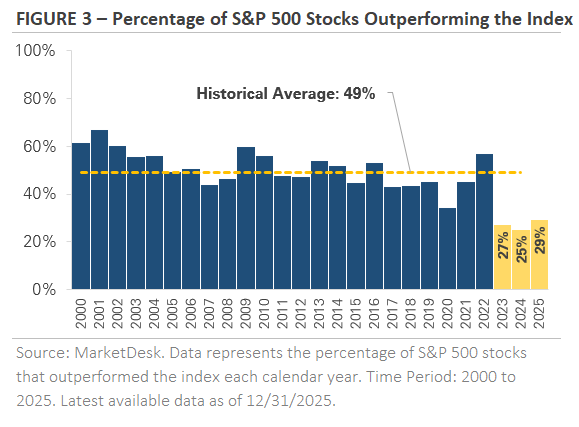 The shift in market leadership was modest, but it was notable. As shown in Figure 3, the percentage of S&P 500 companies outperforming the index has hovered around 30% the past three years. Those are significantly below the historical average of 49% and the three lowest years since 2000, illustrating how a small group of stocks has driven the S&P 500’s gains. The Q4 rotation occurred as the Fed cut interest rates twice, a move that the market believes will ease pressure on companies. Meanwhile, the AI trade in the stock market is becoming more selective as it enters its fourth year. The combination of lower interest rates and increased AI scrutiny could create opportunities for new leadership. If more companies start to outperform, it will represent a significant trend change in the market.
International stocks continued to outperform U.S. stocks, extending their gains from earlier in the year. Both developed and emerging market indices gained nearly +5% in Q4. For the full year, they each gained over +30% and outperformed the S&P 500 by more than +13%. Their outperformance isn’t a case of U.S. weakness, with the S&P 500 gaining nearly +18%, but rather broad international strength. A weaker U.S. dollar played a significant role, with the softness driven by rising trade tensions, policy uncertainty, and a rotation toward international stocks.
Credit Market Recap – Bonds Trade Sideways
The bond market was relatively quiet in Q4. As discussed earlier, the focus centered around the Fed’s rate cut plans. Yields on shorter maturity U.S. Treasury bonds fell as the Fed cut twice, while longer maturity yields ended the quarter modestly higher as economic activity remained solid and inflation remained stuck near 3%. Overall, the bond market has transitioned from a source of volatility during the Fed’s 2022-2023 rate-hiking cycle to relative stability and a source of income in 2025. Changing rate cut expectations and economic uncertainty have triggered periodic volatility, but the overall path has been smoother.
Corporate bonds traded higher in Q4. Credit spreads widened during periods of stock market volatility, but the moves were orderly and short-lived. The investment-grade and high-yield bond markets showed few signs of stress, and default expectations remained low. Both investment-grade and high-yield gained roughly +1% for the quarter, capping off strong full-year returns of approximately +8%.
As the new year begins, credit spreads remain tight by historical standards. Investment-grade and high-yield spreads are at their tightest levels in decades, signaling investor confidence in corporate fundamentals and the economy. While spread tightening has supported corporate bond returns, it means valuations are no longer cheap. Corporate bonds offer compelling yields for income-focused investors, but they also come with important trade-offs. When spreads are this tight, there’s less margin of safety if earnings or economic growth disappoint. For investors, it’s important to balance the income potential with credit risk.
2026 Outlook – Market Strength Raises the Bar
As we turn the page to 2026, it’s worth reflecting on a year that was both extremely eventful and remarkably resilient. The year began with the stock market hitting new highs in February, only to reverse sharply as trade policy uncertainty triggered a nearly -20% sell-off. However, the sell-off set the stage for one of the strongest recoveries in decades. Fueled by AI enthusiasm, rate cut expectations, strong corporate earnings, and resilient economic growth, the S&P 500 set more than 35 new highs through year-end.
The S&P 500 finished 2025 with a nearly +18% gain, its third consecutive year of double-digit gains. It’s been an impressive run that included a global pandemic, aggressive rate hikes, and the rise of AI. Through it all, the stock market’s gains have been supported by solid economic growth and strong corporate earnings. Looking ahead, the bar is now higher. Today’s starting point is very different than a few years ago, or even last year. Stock valuations are more expensive, credit spreads are near their tightest levels in decades, and expectations for earnings and economic growth are high. None of these are red flags on their own, but they frame a market that already prices in rate cuts, strong earnings, solid economic growth, and the AI industry’s growth. The combination doesn’t necessarily signal a stock market sell-off, but it leaves less room for positive surprises.
Despite the higher starting point, there are many positives. The tech sector is experiencing a wave of innovation not seen since the internet era of the late 1990s. Companies are generating record profits. The S&P 500’s earnings grew by double digits the past two years, with expectations for solid growth in 2026. Consumers, the engine of the U.S. economy, continue to spend. Interest rates are coming down, which could unlock economic activity that higher rates delayed the past few years. Financial markets are open and functioning, and there’s no clear sign of systemic stress.
As we begin the new year, it’s important to keep the big picture in mind. Markets have delivered impressive returns over the past five years, but each year brings its own surprises. We can’t predict what lies ahead, but we believe a disciplined approach focused on long-term goals, diversification, and risk management is the best way to navigate the market. Our team will continue to closely monitor incoming economic data and evolving market trends to help ensure portfolios remain aligned with your long-term objectives, regardless of what the market does in the short term.
A Truly Unique Wealth Management Experience
Let’s create a financial plan and investment strategy that allows you to live the life of your dreams. Schedule your free consultation today to explore tailored financial strategies designed to secure your future!
Are We Right for You?
THIS QUARTER IN NUMBERS
Market and Economic Data Disclosures
The information and opinions provided herein are provided as general market commentary only and are subject to change at any time without notice. This commentary may contain forward-looking statements that are subject to various risks and uncertainties. None of the events or outcomes mentioned here may come to pass, and actual results may differ materially from those expressed or implied in these statements. No mention of a particular security, index, or other instrument in this report constitutes a recommendation to buy, sell, or hold that or any other security, nor does it constitute an opinion on the suitability of any security or index. The report is strictly an informational publication and has been prepared without regard to the particular investments and circumstances of the recipient.
Past performance does not guarantee or indicate future results. Any index performance mentioned is for illustrative purposes only and does not reflect any management fees, transaction costs, or expenses. Indexes are unmanaged, and one cannot invest directly in an index. Index performance does not represent the actual performance that would be achieved by investing in a fund.
Stock performance and fundamental data is based on the following instruments: SPDR S&P 500 ETF (SPY), SPDR Dow Jones ETF (DIA), iShares Russell 2000 ETF (IWM), iShares Russell 1000 Growth ETF (IWF), iShares Russell 1000 Value ETF (IWD), iShares MSCI EAFE ETF (EFA), iShares MSCI Emerging Markets ETF (EEM), Invesco QQQ Trust (QQQ).
Fixed Income performance is based on the following instruments: iShares Core U.S. Aggregate Bond ETF (AGG), iShares Investment Grade Corporate ETF (LQD), iShares National Muni Bond ETF (MUB), iShares High Yield Corporate ETF (HYG).
Fixed Income yields and key rates are based on the following instruments: Bloomberg US Aggregate, ICE BofA US Corporate, ICE BofA US Municipal Securities, ICE BofA US High Yield, 2 Year US Benchmark Bond, 10 Year US Benchmark Bond, 30 Year US Benchmark Bond, 30 Year US Fixed Mortgage Rate, US Prime Rate.
Commodity prices are based on the following instruments: Crude Oil WTI (NYM $/bbl), Gasoline Regular U.S. Gulf Coast ($/gal), Natural Gas (NYM $/mmbtu), Propane (NYM $/gal), Ethanol (CRB $/gallon), Gold (NYM $/ozt), Silver (NYM $/ozt), Copper NYMEX ($/lb), U.S. Midwest Domestic Hot-Rolled Coil Steel (NYM $/st), Corn (CBT $/bu), Soybeans (Chicago $/bu).
U.S. Style performance is based on the following instruments: iShares Russell 1000 Value ETF (IWD), SPDR S&P 500 ETF Trust (SPY), iShares Russell 1000 Growth ETF (IWF), iShares Russell Mid-Cap Value ETF (IWS), iShares Russell Midcap ETF (IWR), iShares Russell Mid-Cap Growth ETF (IWP), iShares Russell 2000 Value ETF (IWN), iShares Russell 2000 ETF (IWM), iShares Russell 2000 Growth ETF (IWO).
U.S. Sector performance is based on the following instruments: Consumer Discretionary Sector SPDR ETF (XLY), Consumer Staples Sector SPDR ETF (XLP), Energy Sector SPDR ETF (XLE), Financial Sector SPDR ETF (XLF), Health Care Sector SPDR ETF (XLV), Industrial Sector SPDR ETF (XLI), Materials Sector SPDR ETF (XLB), Technology Sector SPDR ETF (XLK), Communication Services Sector SPDR ETF (XLC), Utilities Sector SPDR ETF (XLU), Real Estate Sector SPDR ETF (XLRE).
Figure 1 Notes: The top chart graphs the unemployment rate. Time Period: December 2020 to December 2025. Source: Department of Labor. The second chart graphs the year-over-year growth rate of retail sales. Time Period: December 2021 to December 2025. Source: U.S. Census Bureau. The third chart graphs the homebuilder sentiment index. Time Period: December 2020 to December 2025. Source: NAHB. The bottom chart graphs the quarter-over quarter annualized growth rate of real GDP. Time Period: Q1 2021 to Q3 2025. Source: U.S. Bureau of Economic Analysis. Latest available data as of 12/31/2025.
Figure 2 Notes: Data represents the target federal funds rate. Time Period: December 2020 to December 2025. Source: Federal Reserve. Latest available data of 12/31/2025.
Figure 3 Notes: Data represents the percentage of S&P 500 companies that outperformed the S&P 500 index in each calendar year. Outperformance is based on each individual stock’s price return relative to the price return of the index. Time Period: 2000 to 2025. Source: S&P Global. Latest available data of 12/31/2025.
Concerns or questions about how your investment portfolio will hold up in the current market environment? Contact Financial Synergies today.
We are a boutique, financial advisory and total wealth management firm with over 35 years helping clients navigate turbulent markets. To learn more about our approach to investment management please reach out to us. One of our seasoned advisors would be happy to help you build a custom financial plan to help ensure you accomplish your financial goals and objectives. Schedule a conversation with us today.
More relevant articles by Financial Synergies:
Blog Disclosures
This content, which may contain security-related opinions and/or information, is provided for informational purposes only and should not be relied upon in any manner as professional advice, or an endorsement of any practices, products or services. There can be no guarantees or assurances that the views expressed here will be applicable for any particular facts or circumstances, and should not be relied upon in any manner. You should consult your own financial advisors as to legal, business, tax, and other related matters concerning any investment.
The commentary in this “post” (including any related blogs, videos, and social media) reflects the personal opinions, viewpoints, and analyses of the Financial Synergies Wealth Advisors, Inc. employees providing such comments, and should not be regarded as the views of Financial Synergies Wealth Advisors, Inc. or its respective affiliates or as a description of advisory services provided by Financial Synergies Wealth Advisors, Inc. or performance returns of any Financial Synergies Wealth Advisors, Inc. client.
Any opinions expressed herein do not constitute or imply endorsement, sponsorship, or recommendation by Financial Synergies Wealth Advisors, Inc. or its employees. The views reflected in the commentary are subject to change at any time without notice.
Nothing on this website or Blog constitutes investment or financial planning advice, performance data or any recommendation that any particular security, portfolio of securities, transaction or investment strategy is suitable for any specific person. It also should not be construed as an offer soliciting the purchase or sale of any security mentioned. Nor should it be construed as an offer to provide investment advisory services by Financial Synergies Wealth Advisors, Inc.
Any mention of a particular security and related performance data is not a recommendation to buy or sell that security. Financial Synergies Wealth Advisors, Inc. manages its clients’ accounts using a variety of investment techniques and strategies, which are not necessarily discussed in the commentary. Investments in securities involve the risk of loss. Past performance is no guarantee of future results.
Any charts provided here or on any related Financial Synergies Wealth Advisors, Inc. personnel content outlets are for informational purposes only, and should also not be relied upon when making any investment decision. Any indices referenced for comparison are unmanaged and cannot be invested into directly. As always please remember investing involves risk and possible loss of principal capital; please seek advice from a licensed professional. Any projections, estimates, forecasts, targets, prospects and/or opinions expressed in these materials are subject to change without notice and may differ or be contrary to opinions expressed by others. Information in charts have been obtained from third-party sources and data, and may include those from portfolio securities of funds managed by Financial Synergies Wealth Advisors, Inc. While taken from sources believed to be reliable, Financial Synergies Wealth Advisors, Inc. has not independently verified such information and makes no representations about the enduring accuracy of the information or its appropriateness for a given situation. All content speaks only as of the date indicated.
Financial Synergies Wealth Advisors, Inc. is a registered investment adviser. Advisory services are only offered to clients or prospective clients where Financial Synergies Wealth Advisors, Inc. and its representatives are properly licensed or exempt from licensure. Investments in securities involve the risk of loss. Past performance is no guarantee of future results.
See Full Disclosures Page Here
 Skip to content


4th Quarter 2025 Market and Economic Review
4th Quarter 2025 Market and Economic Review
Key Updates on the Economy & Markets
Markets navigated a complex environment in Q4. The quarter started with a government shutdown, which lasted 43 days and delayed key economic data releases.
The lack of timely information made it difficult to assess the economy’s strength and contributed to periods of volatility as the market reacted to incomplete information. The Fed cut interest rates by -0.50% but signaled a pause, hinting that it could cut less than the market expects in 2026. Investors remain excited about the potential of artificial intelligence, but they’ve become more focused on which companies are best positioned to turn AI demand into near-term profits. Against this backdrop, the S&P 500, Nasdaq, and small-cap stocks each set new highs. In this letter, we recap Q4’s defining themes and events, review performance across key market areas, and look ahead to 2026.
If you would prefer to download a PDF copy of this report, one is provided here: 4th Quarter 2025 Market and Economic Review.
Government Shutdown Creates a Data Fog
The main story in Q4 was the government shutdown and its impact on economic visibility. The shutdown started on October 1st and immediately disrupted the release of key reports on employment, inflation, and growth. To fill the data gap, the market and economists turned to corporate earnings reports and surveys from non-government sources. The shutdown lasted through mid-November, making it the longest in history, and it left behind a data backlog that is still being cleared as the new year begins.
The data reveal a late-cycle economy that is slowing but not breaking. Labor market conditions are soft, consumer spending is slowing, and housing is under pressure, but the economy shows few signs of significant stress. The strong Q3 GDP reading indicates the economy reaccelerated after slowing in Q1, suggesting consumers and businesses altered their behavior in 2025 due to shifting trade policy and tariffs. Now that the trade policy uncertainty has eased, there’s a debate about where economic activity will settle in 2026. The uncertainty explains the Fed’s cautious tone and the market’s heightened sensitivity to new data.
Fed Cuts Twice but Signals a Pause in Early 2026
The Federal Reserve continued its rate-cutting cycle in Q4, but policymakers delivered a more nuanced message than simply lowering rates and offering forward guidance. Figure 2 shows the Fed has cut interest rates by a total of -1.75% since starting its rate-cutting cycle in September 2024. Two of those cuts came in Q4, with -0.25% reductions at the October and December meetings. However, the messaging behind the two cuts changed. Officials have grown more cautious and divided, with several voting members favoring either no cut or a larger cut, and they’ve emphasized that future rate cuts will depend on incoming data.
The question is what happens next. By quarter-end, Fed officials made clear that the threshold for additional rate hikes is high, but they also stressed the need for flexibility and patience. The current backdrop is a mix of cooling inflation, a soft labor market, and a still-expanding economy. Looking at Figure 2, the setup is similar to late 2024, when the Fed cut multiple times before pausing for nine months. This time it’s the shutdown data fog making it difficult for the Fed to forecast policy. The Fed has signaled that it will pause in early 2026 and potentially cut fewer times than the market expects. The prospect of additional rate cuts and lower interest rates is supportive in principle, but the policy outlook is now more sensitive to incoming data. That sensitivity contributed to the Q4 stock market volatility, and it will likely remain a market driver in early 2026.
The AI Trade Becomes More Selective
Artificial intelligence remained a key investment theme in Q4, but the narrative matured. AI stocks entered the quarter with strong momentum, powered by robust earnings, a boom in data center construction, and a growing list of large-scale infrastructure investment projects. Investors were optimistic that AI capex would translate into growth and increased profitability, and many AI-related stocks benefited from broad enthusiasm toward the industry.
Midway through the quarter, the market’s focus shifted. Earnings reports continued to signal strong demand for AI-related computing power and data centers, and leading tech companies reported large, growing backlogs. However, investors started to look beyond headline growth and focus on AI’s economics. Questions emerged about the capital needed to build and maintain data centers, the impact of aggressive capex spending on balance sheets, and whether companies could maintain the current pace of AI infrastructure spending without pressuring cash flow.
The market became more selective. Companies involved in large-scale AI projects faced increased scrutiny, especially where spending plans outpaced near-term cash flow or relied on external financing like debt. Strong earnings and ambitious spending plans were no longer enough to push a company’s stock price higher, and sector leadership shifted toward firms demonstrating pricing power and a path to profitability. The changing AI narrative created periods of volatility and rotation within the tech sector, but it doesn’t necessarily mean the end of the AI trade. As with many transformative technologies, the initial excitement appears to be giving way to a focus on execution and profitability rather than broad enthusiasm and growth at any cost.
Equity Market Recap – Stock Market Ends the Year Near All-Time Highs
Stocks closed out the year with another quarter of gains, building on their momentum from earlier in the year. The S&P 500 gained +2.7% in Q4, bringing its year-to-date return to nearly +18%. The Nasdaq 100, an index of leading tech companies, gained +2.5%, raising its full-year return to +21%. Those headline returns were constructive, but the main development was a shift in market leadership. Large-cap value proxies led the market, with the Dow Jones Industrial Average and the Russell 1000 Value each gaining approximately +4.0%. The Russell 2000 gained +2.2%, with small-cap stocks rallying to new highs as the Fed cut twice.
Despite solid gains across the stock market, the pace of the rally continued to slow from the second and third quarters. Sector breadth also remained narrow, with only two S&P 500 sectors outperforming the broader index. Health care was the top-performing sector, benefiting from renewed interest amid increased AI scrutiny and a pause in tech leadership. The sector’s defensiveness and improved earnings stability were catalysts, but the quarter wasn’t defined by a flight to safety. The defensive trio of real estate, utilities, and consumer staples were the weakest sectors, signaling limited investor concern about the economy.
International stocks continued to outperform U.S. stocks, extending their gains from earlier in the year. Both developed and emerging market indices gained nearly +5% in Q4. For the full year, they each gained over +30% and outperformed the S&P 500 by more than +13%. Their outperformance isn’t a case of U.S. weakness, with the S&P 500 gaining nearly +18%, but rather broad international strength. A weaker U.S. dollar played a significant role, with the softness driven by rising trade tensions, policy uncertainty, and a rotation toward international stocks.
Credit Market Recap – Bonds Trade Sideways
The bond market was relatively quiet in Q4. As discussed earlier, the focus centered around the Fed’s rate cut plans. Yields on shorter maturity U.S. Treasury bonds fell as the Fed cut twice, while longer maturity yields ended the quarter modestly higher as economic activity remained solid and inflation remained stuck near 3%. Overall, the bond market has transitioned from a source of volatility during the Fed’s 2022-2023 rate-hiking cycle to relative stability and a source of income in 2025. Changing rate cut expectations and economic uncertainty have triggered periodic volatility, but the overall path has been smoother.
Corporate bonds traded higher in Q4. Credit spreads widened during periods of stock market volatility, but the moves were orderly and short-lived. The investment-grade and high-yield bond markets showed few signs of stress, and default expectations remained low. Both investment-grade and high-yield gained roughly +1% for the quarter, capping off strong full-year returns of approximately +8%.
As the new year begins, credit spreads remain tight by historical standards. Investment-grade and high-yield spreads are at their tightest levels in decades, signaling investor confidence in corporate fundamentals and the economy. While spread tightening has supported corporate bond returns, it means valuations are no longer cheap. Corporate bonds offer compelling yields for income-focused investors, but they also come with important trade-offs. When spreads are this tight, there’s less margin of safety if earnings or economic growth disappoint. For investors, it’s important to balance the income potential with credit risk.
2026 Outlook – Market Strength Raises the Bar
As we turn the page to 2026, it’s worth reflecting on a year that was both extremely eventful and remarkably resilient. The year began with the stock market hitting new highs in February, only to reverse sharply as trade policy uncertainty triggered a nearly -20% sell-off. However, the sell-off set the stage for one of the strongest recoveries in decades. Fueled by AI enthusiasm, rate cut expectations, strong corporate earnings, and resilient economic growth, the S&P 500 set more than 35 new highs through year-end.
The S&P 500 finished 2025 with a nearly +18% gain, its third consecutive year of double-digit gains. It’s been an impressive run that included a global pandemic, aggressive rate hikes, and the rise of AI. Through it all, the stock market’s gains have been supported by solid economic growth and strong corporate earnings. Looking ahead, the bar is now higher. Today’s starting point is very different than a few years ago, or even last year. Stock valuations are more expensive, credit spreads are near their tightest levels in decades, and expectations for earnings and economic growth are high. None of these are red flags on their own, but they frame a market that already prices in rate cuts, strong earnings, solid economic growth, and the AI industry’s growth. The combination doesn’t necessarily signal a stock market sell-off, but it leaves less room for positive surprises.
Despite the higher starting point, there are many positives. The tech sector is experiencing a wave of innovation not seen since the internet era of the late 1990s. Companies are generating record profits. The S&P 500’s earnings grew by double digits the past two years, with expectations for solid growth in 2026. Consumers, the engine of the U.S. economy, continue to spend. Interest rates are coming down, which could unlock economic activity that higher rates delayed the past few years. Financial markets are open and functioning, and there’s no clear sign of systemic stress.
As we begin the new year, it’s important to keep the big picture in mind. Markets have delivered impressive returns over the past five years, but each year brings its own surprises. We can’t predict what lies ahead, but we believe a disciplined approach focused on long-term goals, diversification, and risk management is the best way to navigate the market. Our team will continue to closely monitor incoming economic data and evolving market trends to help ensure portfolios remain aligned with your long-term objectives, regardless of what the market does in the short term.
A Truly Unique Wealth Management Experience
Let’s create a financial plan and investment strategy that allows you to live the life of your dreams. Schedule your free consultation today to explore tailored financial strategies designed to secure your future!
THIS QUARTER IN NUMBERS
Market and Economic Data Disclosures
The information and opinions provided herein are provided as general market commentary only and are subject to change at any time without notice. This commentary may contain forward-looking statements that are subject to various risks and uncertainties. None of the events or outcomes mentioned here may come to pass, and actual results may differ materially from those expressed or implied in these statements. No mention of a particular security, index, or other instrument in this report constitutes a recommendation to buy, sell, or hold that or any other security, nor does it constitute an opinion on the suitability of any security or index. The report is strictly an informational publication and has been prepared without regard to the particular investments and circumstances of the recipient.
Past performance does not guarantee or indicate future results. Any index performance mentioned is for illustrative purposes only and does not reflect any management fees, transaction costs, or expenses. Indexes are unmanaged, and one cannot invest directly in an index. Index performance does not represent the actual performance that would be achieved by investing in a fund.
Stock performance and fundamental data is based on the following instruments: SPDR S&P 500 ETF (SPY), SPDR Dow Jones ETF (DIA), iShares Russell 2000 ETF (IWM), iShares Russell 1000 Growth ETF (IWF), iShares Russell 1000 Value ETF (IWD), iShares MSCI EAFE ETF (EFA), iShares MSCI Emerging Markets ETF (EEM), Invesco QQQ Trust (QQQ).
Fixed Income performance is based on the following instruments: iShares Core U.S. Aggregate Bond ETF (AGG), iShares Investment Grade Corporate ETF (LQD), iShares National Muni Bond ETF (MUB), iShares High Yield Corporate ETF (HYG).
Fixed Income yields and key rates are based on the following instruments: Bloomberg US Aggregate, ICE BofA US Corporate, ICE BofA US Municipal Securities, ICE BofA US High Yield, 2 Year US Benchmark Bond, 10 Year US Benchmark Bond, 30 Year US Benchmark Bond, 30 Year US Fixed Mortgage Rate, US Prime Rate.
Commodity prices are based on the following instruments: Crude Oil WTI (NYM $/bbl), Gasoline Regular U.S. Gulf Coast ($/gal), Natural Gas (NYM $/mmbtu), Propane (NYM $/gal), Ethanol (CRB $/gallon), Gold (NYM $/ozt), Silver (NYM $/ozt), Copper NYMEX ($/lb), U.S. Midwest Domestic Hot-Rolled Coil Steel (NYM $/st), Corn (CBT $/bu), Soybeans (Chicago $/bu).
U.S. Style performance is based on the following instruments: iShares Russell 1000 Value ETF (IWD), SPDR S&P 500 ETF Trust (SPY), iShares Russell 1000 Growth ETF (IWF), iShares Russell Mid-Cap Value ETF (IWS), iShares Russell Midcap ETF (IWR), iShares Russell Mid-Cap Growth ETF (IWP), iShares Russell 2000 Value ETF (IWN), iShares Russell 2000 ETF (IWM), iShares Russell 2000 Growth ETF (IWO).
U.S. Sector performance is based on the following instruments: Consumer Discretionary Sector SPDR ETF (XLY), Consumer Staples Sector SPDR ETF (XLP), Energy Sector SPDR ETF (XLE), Financial Sector SPDR ETF (XLF), Health Care Sector SPDR ETF (XLV), Industrial Sector SPDR ETF (XLI), Materials Sector SPDR ETF (XLB), Technology Sector SPDR ETF (XLK), Communication Services Sector SPDR ETF (XLC), Utilities Sector SPDR ETF (XLU), Real Estate Sector SPDR ETF (XLRE).
Figure 1 Notes: The top chart graphs the unemployment rate. Time Period: December 2020 to December 2025. Source: Department of Labor. The second chart graphs the year-over-year growth rate of retail sales. Time Period: December 2021 to December 2025. Source: U.S. Census Bureau. The third chart graphs the homebuilder sentiment index. Time Period: December 2020 to December 2025. Source: NAHB. The bottom chart graphs the quarter-over quarter annualized growth rate of real GDP. Time Period: Q1 2021 to Q3 2025. Source: U.S. Bureau of Economic Analysis. Latest available data as of 12/31/2025.
Figure 2 Notes: Data represents the target federal funds rate. Time Period: December 2020 to December 2025. Source: Federal Reserve. Latest available data of 12/31/2025.
Figure 3 Notes: Data represents the percentage of S&P 500 companies that outperformed the S&P 500 index in each calendar year. Outperformance is based on each individual stock’s price return relative to the price return of the index. Time Period: 2000 to 2025. Source: S&P Global. Latest available data of 12/31/2025.
Concerns or questions about how your investment portfolio will hold up in the current market environment? Contact Financial Synergies today.
We are a boutique, financial advisory and total wealth management firm with over 35 years helping clients navigate turbulent markets. To learn more about our approach to investment management please reach out to us. One of our seasoned advisors would be happy to help you build a custom financial plan to help ensure you accomplish your financial goals and objectives. Schedule a conversation with us today.
More relevant articles by Financial Synergies:
Blog Disclosures
This content, which may contain security-related opinions and/or information, is provided for informational purposes only and should not be relied upon in any manner as professional advice, or an endorsement of any practices, products or services. There can be no guarantees or assurances that the views expressed here will be applicable for any particular facts or circumstances, and should not be relied upon in any manner. You should consult your own financial advisors as to legal, business, tax, and other related matters concerning any investment.
The commentary in this “post” (including any related blogs, videos, and social media) reflects the personal opinions, viewpoints, and analyses of the Financial Synergies Wealth Advisors, Inc. employees providing such comments, and should not be regarded as the views of Financial Synergies Wealth Advisors, Inc. or its respective affiliates or as a description of advisory services provided by Financial Synergies Wealth Advisors, Inc. or performance returns of any Financial Synergies Wealth Advisors, Inc. client.
Any opinions expressed herein do not constitute or imply endorsement, sponsorship, or recommendation by Financial Synergies Wealth Advisors, Inc. or its employees. The views reflected in the commentary are subject to change at any time without notice.
Nothing on this website or Blog constitutes investment or financial planning advice, performance data or any recommendation that any particular security, portfolio of securities, transaction or investment strategy is suitable for any specific person. It also should not be construed as an offer soliciting the purchase or sale of any security mentioned. Nor should it be construed as an offer to provide investment advisory services by Financial Synergies Wealth Advisors, Inc.
Any mention of a particular security and related performance data is not a recommendation to buy or sell that security. Financial Synergies Wealth Advisors, Inc. manages its clients’ accounts using a variety of investment techniques and strategies, which are not necessarily discussed in the commentary. Investments in securities involve the risk of loss. Past performance is no guarantee of future results.
Any charts provided here or on any related Financial Synergies Wealth Advisors, Inc. personnel content outlets are for informational purposes only, and should also not be relied upon when making any investment decision. Any indices referenced for comparison are unmanaged and cannot be invested into directly. As always please remember investing involves risk and possible loss of principal capital; please seek advice from a licensed professional. Any projections, estimates, forecasts, targets, prospects and/or opinions expressed in these materials are subject to change without notice and may differ or be contrary to opinions expressed by others. Information in charts have been obtained from third-party sources and data, and may include those from portfolio securities of funds managed by Financial Synergies Wealth Advisors, Inc. While taken from sources believed to be reliable, Financial Synergies Wealth Advisors, Inc. has not independently verified such information and makes no representations about the enduring accuracy of the information or its appropriateness for a given situation. All content speaks only as of the date indicated.
Financial Synergies Wealth Advisors, Inc. is a registered investment adviser. Advisory services are only offered to clients or prospective clients where Financial Synergies Wealth Advisors, Inc. and its representatives are properly licensed or exempt from licensure. Investments in securities involve the risk of loss. Past performance is no guarantee of future results.
See Full Disclosures Page Here
Recent Posts
3rd Quarter 2026 Market and Economic Review
Weekly Market Recap – Q2 GDP Growth, Consumer Spending, AI Capex, & Rising Treasury Yields
Retirement Income Risks: Planning for a Longer Life
Subscribe to Our Blog
Chief Investment Officer | Managing Partner