Monthly Market Update: Stocks Set New Highs as Geopolitical Tensions Ease
For your convenience, we’ve also provided a PDF copy of the Monthly Market Update: Stocks Set New Highs as Geopolitical Tensions Ease.
Monthly Market Summary
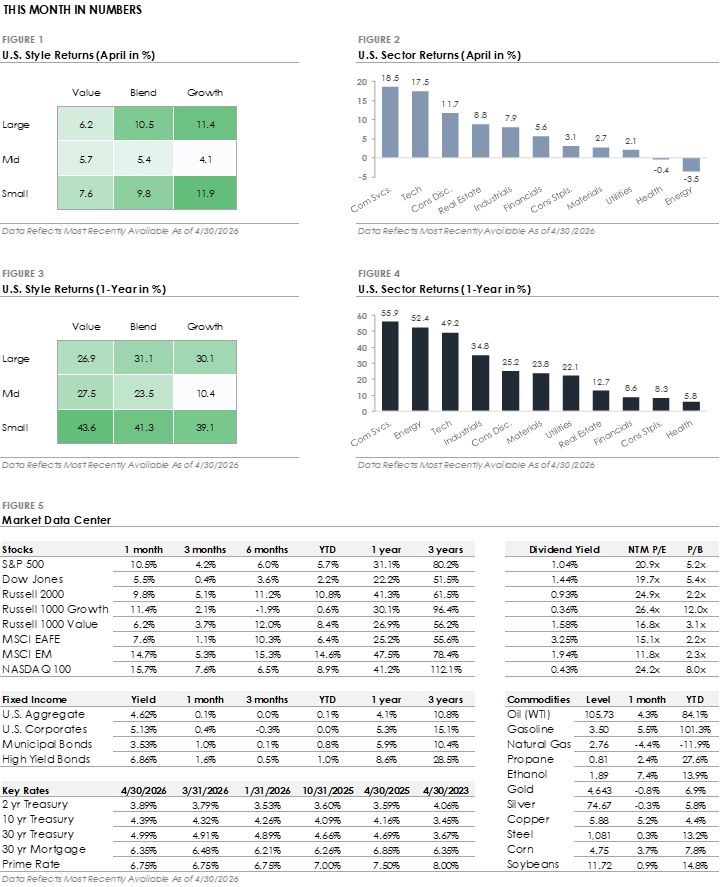
- The S&P 500 Index gained +10.5% in April, recovering its March decline and setting a new high. Communication Services led all S&P 500 sectors with a +18.5% return, followed by Technology (+17.5%) and Consumer Discretionary (+11.7%). Nine of eleven sectors traded higher as stocks recovered from the March selloff, but eight sectors underperformed the index as mega-cap stocks drove the bulk of the gains.
- Bonds traded lower as Treasury yields rose during the month. The U.S. Bond Aggregate returned +0.1% and underperformed corporate bonds as credit spreads tightened. High-yield’s +1.6% total return outpaced investment-grade’s +0.4% return as credit spread tightening benefited lower-quality bonds.
- International stocks underperformed the S&P 500 as U.S. Growth stocks led during the recovery. Emerging markets gained +14.7% and outperformed developed markets’ +7.6% return, with energy-importing regions like Europe and Japan impacted by the continued oil supply disruption.
Markets Rebound as Geopolitical Tensions Ease
Back-to-back ceasefires, first between the U.S. and Iran on April 7 and then between Israel and Lebanon on April 16, changed the market’s outlook. The agreements removed the worst-case scenario, and the reversal was immediate across markets. The S&P 500 erased all its March losses and went on to set a new all-time high by month-end. The Dow surged over 1,300 points the day the U.S.-Iran ceasefire took effect, its best day in a year. The Nasdaq Index gained nearly +16% during the month, driven by a historic semiconductor rally, and the Russell 2000 small-cap index gained +9.8% and set its own record.
The recovery also reached beyond stocks. Credit spreads, which reflect how concerned the bond market is about corporate borrowers, reversed three months of widening in four weeks, and market uncertainty, as measured by the VIX Index, fell to pre-conflict levels.
The relief was broad and fast, but the underlying situation remains unsettled. The Strait of Hormuz, which carries roughly 20% of global oil supply, remains effectively closed, with only a few tankers crossing daily compared to hundreds before the conflict. Oil prices fell sharply on the ceasefire announcements, including the largest single-day decline since 2020, but have since risen back above $100 per barrel. Gasoline remained above $4 a gallon throughout April, and consumer confidence fell to its lowest reading in the University of Michigan survey’s 70-year history. The ceasefires reduced fears of further near-term escalation, and investors moved quickly to price that in. However, the oil supply disruption that’s become a part of the conflict has not been resolved.
AI Is Creating Winners and Losers Within the Tech Sector
The technology sector gained nearly +18% in April, but the gap between its strongest and weakest corners was wide. The divergence is being driven by artificial intelligence, which is simultaneously fueling demand in one part of the sector and raising fundamental questions about another. AI requires massive upfront investment to build and operate, including computer chips, data centers, power generation, and networking equipment. The companies that build the infrastructure are seeing a surge in demand as the physical backbone behind AI is constructed.
At the same time, AI is advancing to the point where it can perform tasks that traditionally require human users interacting with software. AI agents, automated systems that can handle workflows like customer service, data entry, and internal reporting, are raising questions about the future of enterprise software.
The divergence could be seen in markets during April. Semiconductor stocks, which sell computer chips, rose more than +40% over 17 consecutive trading days, the longest uninterrupted winning streak for the group dating back to the early 1990s. Semiconductor funds absorbed $5.5 billion in new investment during the month, and earnings results from major chipmakers confirmed that infrastructure spending is translating into revenue growth.
Enterprise software moved in the opposite direction. Several of the largest names in the industry have declined more than -30% this year, and the selling has even hit companies that beat earnings estimates and raised their forward guidance. The divergence comes as the market works through which business models AI will enhance and which it will disrupt. It’s a question likely to define not only the technology sector but also the broader market for some time.
Disclosures
The information and opinions provided herein are provided as general market commentary only and are subject to change at any time without notice. This commentary may contain forward-looking statements that are subject to various risks and uncertainties. None of the events or outcomes mentioned here may come to pass, and actual results may differ materially from those expressed or implied in these statements. No mention of a particular security, index, or other instrument in this report constitutes a recommendation to buy, sell, or hold that or any other security, nor does it constitute an opinion on the suitability of any security or index. The report is strictly an informational publication and has been prepared without regard to the particular investments and circumstances of the recipient.
Past performance does not guarantee or indicate future results. Any index performance mentioned is for illustrative purposes only and does not reflect any management fees, transaction costs, or expenses. Indexes are unmanaged, and one cannot invest directly in an index. Index performance does not represent the actual performance that would be achieved by investing in a fund.
Stock performance and fundamental data is based on the following instruments: SPDR S&P 500 ETF (SPY), SPDR Dow Jones ETF (DIA), iShares Russell 2000 ETF (IWM), iShares Russell 1000 Growth ETF (IWF), iShares Russell 1000 Value ETF (IWD), iShares MSCI EAFE ETF (EFA), iShares MSCI Emerging Markets ETF (EEM), Invesco QQQ Trust (QQQ).
Fixed Income performance is based on the following instruments: iShares Core U.S. Aggregate Bond ETF (AGG), iShares Investment Grade Corporate ETF (LQD), iShares National Muni Bond ETF (MUB), iShares High Yield Corporate ETF (HYG).
Fixed Income yields and key rates are based on the following instruments: Bloomberg US Aggregate, ICE BofA US Corporate, ICE BofA US Municipal Securities, ICE BofA US High Yield, 2 Year US Benchmark Bond, 10 Year US Benchmark Bond, 30 Year US Benchmark Bond, 30 Year US Fixed Mortgage Rate, US Prime Rate.
Commodity prices are based on the following instruments: Crude Oil WTI (NYM $/bbl), Gasoline Regular U.S. Gulf Coast ($/gal), Natural Gas (NYM $/mmbtu), Propane (NYM $/gal), Ethanol (CRB $/gallon), Gold (NYM $/ozt), Silver (NYM $/ozt), Copper NYMEX ($/lb), U.S. Midwest Domestic Hot-Rolled Coil Steel (NYM $/st), Corn (CBT $/bu), Soybeans (Chicago $/bu).
U.S. Style performance is based on the following instruments: iShares Russell 1000 Value ETF (IWD), SPDR S&P 500 ETF Trust (SPY), iShares Russell 1000 Growth ETF (IWF), iShares Russell Mid-Cap Value ETF (IWS), iShares Russell Midcap ETF (IWR), iShares Russell Mid-Cap Growth ETF (IWP), iShares Russell 2000 Value ETF (IWN), iShares Russell 2000 ETF (IWM), iShares Russell 2000 Growth ETF (IWO).
U.S. Sector performance is based on the following instruments: Consumer Discretionary Sector SPDR ETF (XLY), Consumer Staples Sector SPDR ETF (XLP), Energy Sector SPDR ETF (XLE), Financial Sector SPDR ETF (XLF), Health Care Sector SPDR ETF (XLV), Industrial Sector SPDR ETF (XLI), Materials Sector SPDR ETF (XLB), Technology Sector SPDR ETF (XLK), Communication Services Sector SPDR ETF (XLC), Utilities Sector SPDR ETF (XLU), Real Estate Sector SPDR ETF (XLRE).
Concerns or questions about how your investment portfolio will hold up in the current market environment? Contact Financial Synergies today.
We are a boutique, financial advisory and total wealth management firm with over 35 years helping clients navigate turbulent markets. To learn more about our approach to investment management please reach out to us. One of our seasoned advisors would be happy to help you build a custom financial plan to help ensure you accomplish your financial goals and objectives. Schedule a conversation with us today.
More relevant articles by Financial Synergies:
Blog Disclosures
This content, which contains security-related opinions and/or information, is provided for informational purposes only and should not be relied upon in any manner as professional advice, or an endorsement of any practices, products or services. There can be no guarantees or assurances that the views expressed here will be applicable for any particular facts or circumstances, and should not be relied upon in any manner. You should consult your own financial advisors as to legal, business, tax, and other related matters concerning any investment.
The commentary in this “post” (including any related blogs, videos, and social media) reflects the personal opinions, viewpoints, and analyses of the Financial Synergies Wealth Advisors, Inc. employees providing such comments, and should not be regarded as the views of Financial Synergies Wealth Advisors, Inc. or its respective affiliates or as a description of advisory services provided by Financial Synergies Wealth Advisors, Inc. or performance returns of any Financial Synergies Wealth Advisors, Inc. client.
Any opinions expressed herein do not constitute or imply endorsement, sponsorship, or recommendation by Financial Synergies Wealth Advisors, Inc. or its employees. The views reflected in the commentary are subject to change at any time without notice.
Nothing on this website constitutes investment or financial planning advice, performance data or any recommendation that any particular security, portfolio of securities, transaction or investment strategy is suitable for any specific person. It also should not be construed as an offer soliciting the purchase or sale of any security mentioned. Nor should it be construed as an offer to provide investment advisory services by Financial Synergies Wealth Advisors, Inc.
Any mention of a particular security and related performance data is not a recommendation to buy or sell that security. Financial Synergies Wealth Advisors, Inc. manages its clients’ accounts using a variety of investment techniques and strategies, which are not necessarily discussed in the commentary. Investments in securities involve the risk of loss. Past performance is no guarantee of future results.
Any charts provided here or on any related Financial Synergies Wealth Advisors, Inc. personnel content outlets are for informational purposes only, and should also not be relied upon when making any investment decision. Any indices referenced for comparison are unmanaged and cannot be invested into directly. As always please remember investing involves risk and possible loss of principal capital; please seek advice from a licensed professional. Any projections, estimates, forecasts, targets, prospects and/or opinions expressed in these materials are subject to change without notice and may differ or be contrary to opinions expressed by others. Information in charts have been obtained from third-party sources and data, and may include those from portfolio securities of funds managed by Financial Synergies Wealth Advisors, Inc. While taken from sources believed to be reliable, Financial Synergies Wealth Advisors, Inc. has not independently verified such information and makes no representations about the enduring accuracy of the information or its appropriateness for a given situation. All content speaks only as of the date indicated.
Financial Synergies Wealth Advisors, Inc. is a registered investment adviser. Advisory services are only offered to clients or prospective clients where Financial Synergies Wealth Advisors, Inc. and its representatives are properly licensed or exempt from licensure. Investments in securities involve the risk of loss. Past performance is no guarantee of future results.
See Full Disclosures Page Here
 Skip to content


Monthly Market Update: Stocks Set New Highs as Geopolitical Tensions Ease
Monthly Market Update: Stocks Set New Highs as Geopolitical Tensions Ease
For your convenience, we’ve also provided a PDF copy of the Monthly Market Update: Stocks Set New Highs as Geopolitical Tensions Ease.
Monthly Market Summary
Markets Rebound as Geopolitical Tensions Ease
Back-to-back ceasefires, first between the U.S. and Iran on April 7 and then between Israel and Lebanon on April 16, changed the market’s outlook. The agreements removed the worst-case scenario, and the reversal was immediate across markets. The S&P 500 erased all its March losses and went on to set a new all-time high by month-end. The Dow surged over 1,300 points the day the U.S.-Iran ceasefire took effect, its best day in a year. The Nasdaq Index gained nearly +16% during the month, driven by a historic semiconductor rally, and the Russell 2000 small-cap index gained +9.8% and set its own record.
The recovery also reached beyond stocks. Credit spreads, which reflect how concerned the bond market is about corporate borrowers, reversed three months of widening in four weeks, and market uncertainty, as measured by the VIX Index, fell to pre-conflict levels.
The relief was broad and fast, but the underlying situation remains unsettled. The Strait of Hormuz, which carries roughly 20% of global oil supply, remains effectively closed, with only a few tankers crossing daily compared to hundreds before the conflict. Oil prices fell sharply on the ceasefire announcements, including the largest single-day decline since 2020, but have since risen back above $100 per barrel. Gasoline remained above $4 a gallon throughout April, and consumer confidence fell to its lowest reading in the University of Michigan survey’s 70-year history. The ceasefires reduced fears of further near-term escalation, and investors moved quickly to price that in. However, the oil supply disruption that’s become a part of the conflict has not been resolved.
AI Is Creating Winners and Losers Within the Tech Sector
The technology sector gained nearly +18% in April, but the gap between its strongest and weakest corners was wide. The divergence is being driven by artificial intelligence, which is simultaneously fueling demand in one part of the sector and raising fundamental questions about another. AI requires massive upfront investment to build and operate, including computer chips, data centers, power generation, and networking equipment. The companies that build the infrastructure are seeing a surge in demand as the physical backbone behind AI is constructed.
At the same time, AI is advancing to the point where it can perform tasks that traditionally require human users interacting with software. AI agents, automated systems that can handle workflows like customer service, data entry, and internal reporting, are raising questions about the future of enterprise software.
The divergence could be seen in markets during April. Semiconductor stocks, which sell computer chips, rose more than +40% over 17 consecutive trading days, the longest uninterrupted winning streak for the group dating back to the early 1990s. Semiconductor funds absorbed $5.5 billion in new investment during the month, and earnings results from major chipmakers confirmed that infrastructure spending is translating into revenue growth.
Enterprise software moved in the opposite direction. Several of the largest names in the industry have declined more than -30% this year, and the selling has even hit companies that beat earnings estimates and raised their forward guidance. The divergence comes as the market works through which business models AI will enhance and which it will disrupt. It’s a question likely to define not only the technology sector but also the broader market for some time.
Disclosures
The information and opinions provided herein are provided as general market commentary only and are subject to change at any time without notice. This commentary may contain forward-looking statements that are subject to various risks and uncertainties. None of the events or outcomes mentioned here may come to pass, and actual results may differ materially from those expressed or implied in these statements. No mention of a particular security, index, or other instrument in this report constitutes a recommendation to buy, sell, or hold that or any other security, nor does it constitute an opinion on the suitability of any security or index. The report is strictly an informational publication and has been prepared without regard to the particular investments and circumstances of the recipient.
Past performance does not guarantee or indicate future results. Any index performance mentioned is for illustrative purposes only and does not reflect any management fees, transaction costs, or expenses. Indexes are unmanaged, and one cannot invest directly in an index. Index performance does not represent the actual performance that would be achieved by investing in a fund.
Stock performance and fundamental data is based on the following instruments: SPDR S&P 500 ETF (SPY), SPDR Dow Jones ETF (DIA), iShares Russell 2000 ETF (IWM), iShares Russell 1000 Growth ETF (IWF), iShares Russell 1000 Value ETF (IWD), iShares MSCI EAFE ETF (EFA), iShares MSCI Emerging Markets ETF (EEM), Invesco QQQ Trust (QQQ).
Fixed Income performance is based on the following instruments: iShares Core U.S. Aggregate Bond ETF (AGG), iShares Investment Grade Corporate ETF (LQD), iShares National Muni Bond ETF (MUB), iShares High Yield Corporate ETF (HYG).
Fixed Income yields and key rates are based on the following instruments: Bloomberg US Aggregate, ICE BofA US Corporate, ICE BofA US Municipal Securities, ICE BofA US High Yield, 2 Year US Benchmark Bond, 10 Year US Benchmark Bond, 30 Year US Benchmark Bond, 30 Year US Fixed Mortgage Rate, US Prime Rate.
Commodity prices are based on the following instruments: Crude Oil WTI (NYM $/bbl), Gasoline Regular U.S. Gulf Coast ($/gal), Natural Gas (NYM $/mmbtu), Propane (NYM $/gal), Ethanol (CRB $/gallon), Gold (NYM $/ozt), Silver (NYM $/ozt), Copper NYMEX ($/lb), U.S. Midwest Domestic Hot-Rolled Coil Steel (NYM $/st), Corn (CBT $/bu), Soybeans (Chicago $/bu).
U.S. Style performance is based on the following instruments: iShares Russell 1000 Value ETF (IWD), SPDR S&P 500 ETF Trust (SPY), iShares Russell 1000 Growth ETF (IWF), iShares Russell Mid-Cap Value ETF (IWS), iShares Russell Midcap ETF (IWR), iShares Russell Mid-Cap Growth ETF (IWP), iShares Russell 2000 Value ETF (IWN), iShares Russell 2000 ETF (IWM), iShares Russell 2000 Growth ETF (IWO).
U.S. Sector performance is based on the following instruments: Consumer Discretionary Sector SPDR ETF (XLY), Consumer Staples Sector SPDR ETF (XLP), Energy Sector SPDR ETF (XLE), Financial Sector SPDR ETF (XLF), Health Care Sector SPDR ETF (XLV), Industrial Sector SPDR ETF (XLI), Materials Sector SPDR ETF (XLB), Technology Sector SPDR ETF (XLK), Communication Services Sector SPDR ETF (XLC), Utilities Sector SPDR ETF (XLU), Real Estate Sector SPDR ETF (XLRE).
Concerns or questions about how your investment portfolio will hold up in the current market environment? Contact Financial Synergies today.
We are a boutique, financial advisory and total wealth management firm with over 35 years helping clients navigate turbulent markets. To learn more about our approach to investment management please reach out to us. One of our seasoned advisors would be happy to help you build a custom financial plan to help ensure you accomplish your financial goals and objectives. Schedule a conversation with us today.
More relevant articles by Financial Synergies:
Blog Disclosures
This content, which contains security-related opinions and/or information, is provided for informational purposes only and should not be relied upon in any manner as professional advice, or an endorsement of any practices, products or services. There can be no guarantees or assurances that the views expressed here will be applicable for any particular facts or circumstances, and should not be relied upon in any manner. You should consult your own financial advisors as to legal, business, tax, and other related matters concerning any investment.
The commentary in this “post” (including any related blogs, videos, and social media) reflects the personal opinions, viewpoints, and analyses of the Financial Synergies Wealth Advisors, Inc. employees providing such comments, and should not be regarded as the views of Financial Synergies Wealth Advisors, Inc. or its respective affiliates or as a description of advisory services provided by Financial Synergies Wealth Advisors, Inc. or performance returns of any Financial Synergies Wealth Advisors, Inc. client.
Any opinions expressed herein do not constitute or imply endorsement, sponsorship, or recommendation by Financial Synergies Wealth Advisors, Inc. or its employees. The views reflected in the commentary are subject to change at any time without notice.
Nothing on this website constitutes investment or financial planning advice, performance data or any recommendation that any particular security, portfolio of securities, transaction or investment strategy is suitable for any specific person. It also should not be construed as an offer soliciting the purchase or sale of any security mentioned. Nor should it be construed as an offer to provide investment advisory services by Financial Synergies Wealth Advisors, Inc.
Any mention of a particular security and related performance data is not a recommendation to buy or sell that security. Financial Synergies Wealth Advisors, Inc. manages its clients’ accounts using a variety of investment techniques and strategies, which are not necessarily discussed in the commentary. Investments in securities involve the risk of loss. Past performance is no guarantee of future results.
Any charts provided here or on any related Financial Synergies Wealth Advisors, Inc. personnel content outlets are for informational purposes only, and should also not be relied upon when making any investment decision. Any indices referenced for comparison are unmanaged and cannot be invested into directly. As always please remember investing involves risk and possible loss of principal capital; please seek advice from a licensed professional. Any projections, estimates, forecasts, targets, prospects and/or opinions expressed in these materials are subject to change without notice and may differ or be contrary to opinions expressed by others. Information in charts have been obtained from third-party sources and data, and may include those from portfolio securities of funds managed by Financial Synergies Wealth Advisors, Inc. While taken from sources believed to be reliable, Financial Synergies Wealth Advisors, Inc. has not independently verified such information and makes no representations about the enduring accuracy of the information or its appropriateness for a given situation. All content speaks only as of the date indicated.
Financial Synergies Wealth Advisors, Inc. is a registered investment adviser. Advisory services are only offered to clients or prospective clients where Financial Synergies Wealth Advisors, Inc. and its representatives are properly licensed or exempt from licensure. Investments in securities involve the risk of loss. Past performance is no guarantee of future results.
See Full Disclosures Page Here
Recent Posts
Happy Birthday to the Bull Market 🎉
Quarterly Webinar: Q4 2026 Market and Economic Themes
Medicare Open Enrollment 2026: What to Know
Subscribe to Our Blog
Chief Investment Officer | Managing Partner