- July 1, 2016
- Heath Hightower

The date was December 31, 1999. I remember going to Wal-Mart to search the picked-over shelves for bottled water, canned food, and ammunition. Why? Y2K was coming! The world was about to end, and I was preparing for inevitable doom.
More recently the British voted to exit the European Union (EU) on June 23, 2016. And, in case you’ve been living under a rock the last couple of weeks, the vote decimated global stock markets and caused the British pound to fall to its lowest level in decades. It’s as if the world is ending… But is it really?
Today, with the benefit of hindsight, we know that Y2K was not nearly as disastrous as our imaginations allowed us to think. But, I thought it would be interesting to turn back the clock to see how the market performed during other moments of crisis and then see if the market recovered in the years following the crisis. What I found may surprise you.

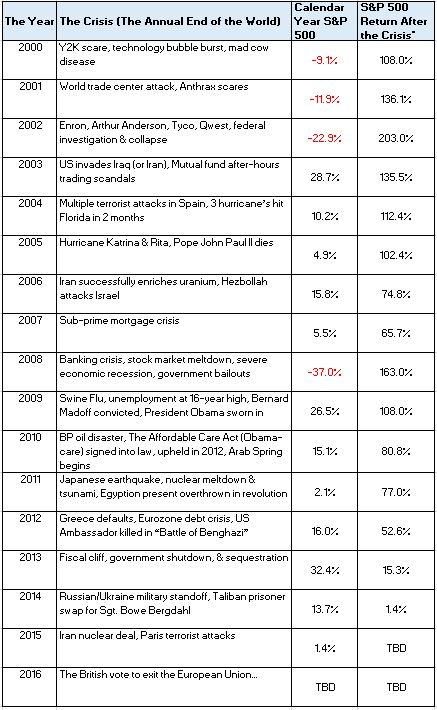
In the year 2000, the world was ending because of the technology bubble, and mad cow disease. The stock market lost 9.1% that year. But, the S&P 500 went on to make a stunning 108% in the following 15 years (through Dec 2015).
In the year 2001, the world was ending because the world trade center was attacked by terrorists. Thousands of Americans were killed and wounded. Anthrax packages riddled government buildings and dot.com stocks continued to plague the US markets. The market lost about 12% for the year. But, the S&P 500 went on to make 203% in the following 14 years*.
In the year 2002, the world was ending because some of the largest and most trusted companies in America were under federal investigation. Enron, Arthur Anderson, Tyco and many others collapsed as a result of these investigations. The market lost 22% for the year, making it the worst calendar year return in 28 years. But, the S&P 500 went on to make 136% in the following 13 years (through Dec 2015).
I could go on, but the chart above speaks for itself. Over the long term, our market tends to be quite resilient. Since the year 2000, we’ve seen hundreds of terrorist attacks, natural disasters, nuclear meltdowns, political scandals, government defaults, corporate greed, International instability and all-out war. Each of these crises seemed like Armageddon at the time. But we often forget how resilient our markets really are. It leaves me to wonder how the paragraph about the year 2016 will read. It’s hard to say exactly what it will say, but here’s my best guess…
In the year 2016, the world was ending because the British voted to exit the European Union. The _______________ crisis also surprised the markets. The market lost/made _______% for the year. The S&P 500 went on to make ________% in the years following the crisis.
*S&P Return is the mentioned start date through December 31, 2015.
Sources: Morningstar Direct, Morningstar.com, Dimensional Returns Web, Investopedia.com, OnThisDay.com, JP Morgan’s Guide to the Markets 2016


