Investors continue to face a wall of worry built on international trade, but reinforced by concerns over Italian banks, relations with North Korea, and more. But even with all these concerns, U.S. stocks overall are positive for the year.
Why have these headlines affected the U.S. market so dramatically since the end of January? As we’ve discussed in the past, over the long run, prices in the stock market are based on both economic fundamentals (i.e. “cash flows”) and perceptions of risk (i.e. the “discount rate”). Last year, the stars aligned on both fronts. Global growth had swung into high gear while perceptions of risk were at historic lows. This resulted in a rapid rise in the stock market with little to no volatility.
But as any long-term investor knows, such low levels of volatility are unsustainable. Concerns that were pushed by the wayside last year have returned to the fore. Thus, the question isn’t what’s driving volatility – it’s whether we’re back to “normal” levels.
The administration’s position on international trade has been known since before the 2016 presidential election. Additionally, the cracks in Italian banks and in other Eurozone fundamentals have been well understood by investors since at least 2010. This is not to diminish the severity of these concerns. Instead, it’s to argue that these are risks that thoughtful investors should price into the market, rather than reasons to jump in and out of the market.
Here are three charts that dive deeper into this important topic:
1. The market is throwing a tariff tantrum
 Markets continue to react to ongoing threats of trade tariffs between the U.S. and its major trading partners. In all likelihood, current uncertainty represents an opening gambit in trade negotiations, rather than an ending point. This is because trade policy has been a key political issue for the administration. Many U.S. workers have faced tremendous difficulty as technology has made many jobs obsolete and globalization has moved jobs overseas. The administration’s goal of protecting domestic industries taps into this unrest.
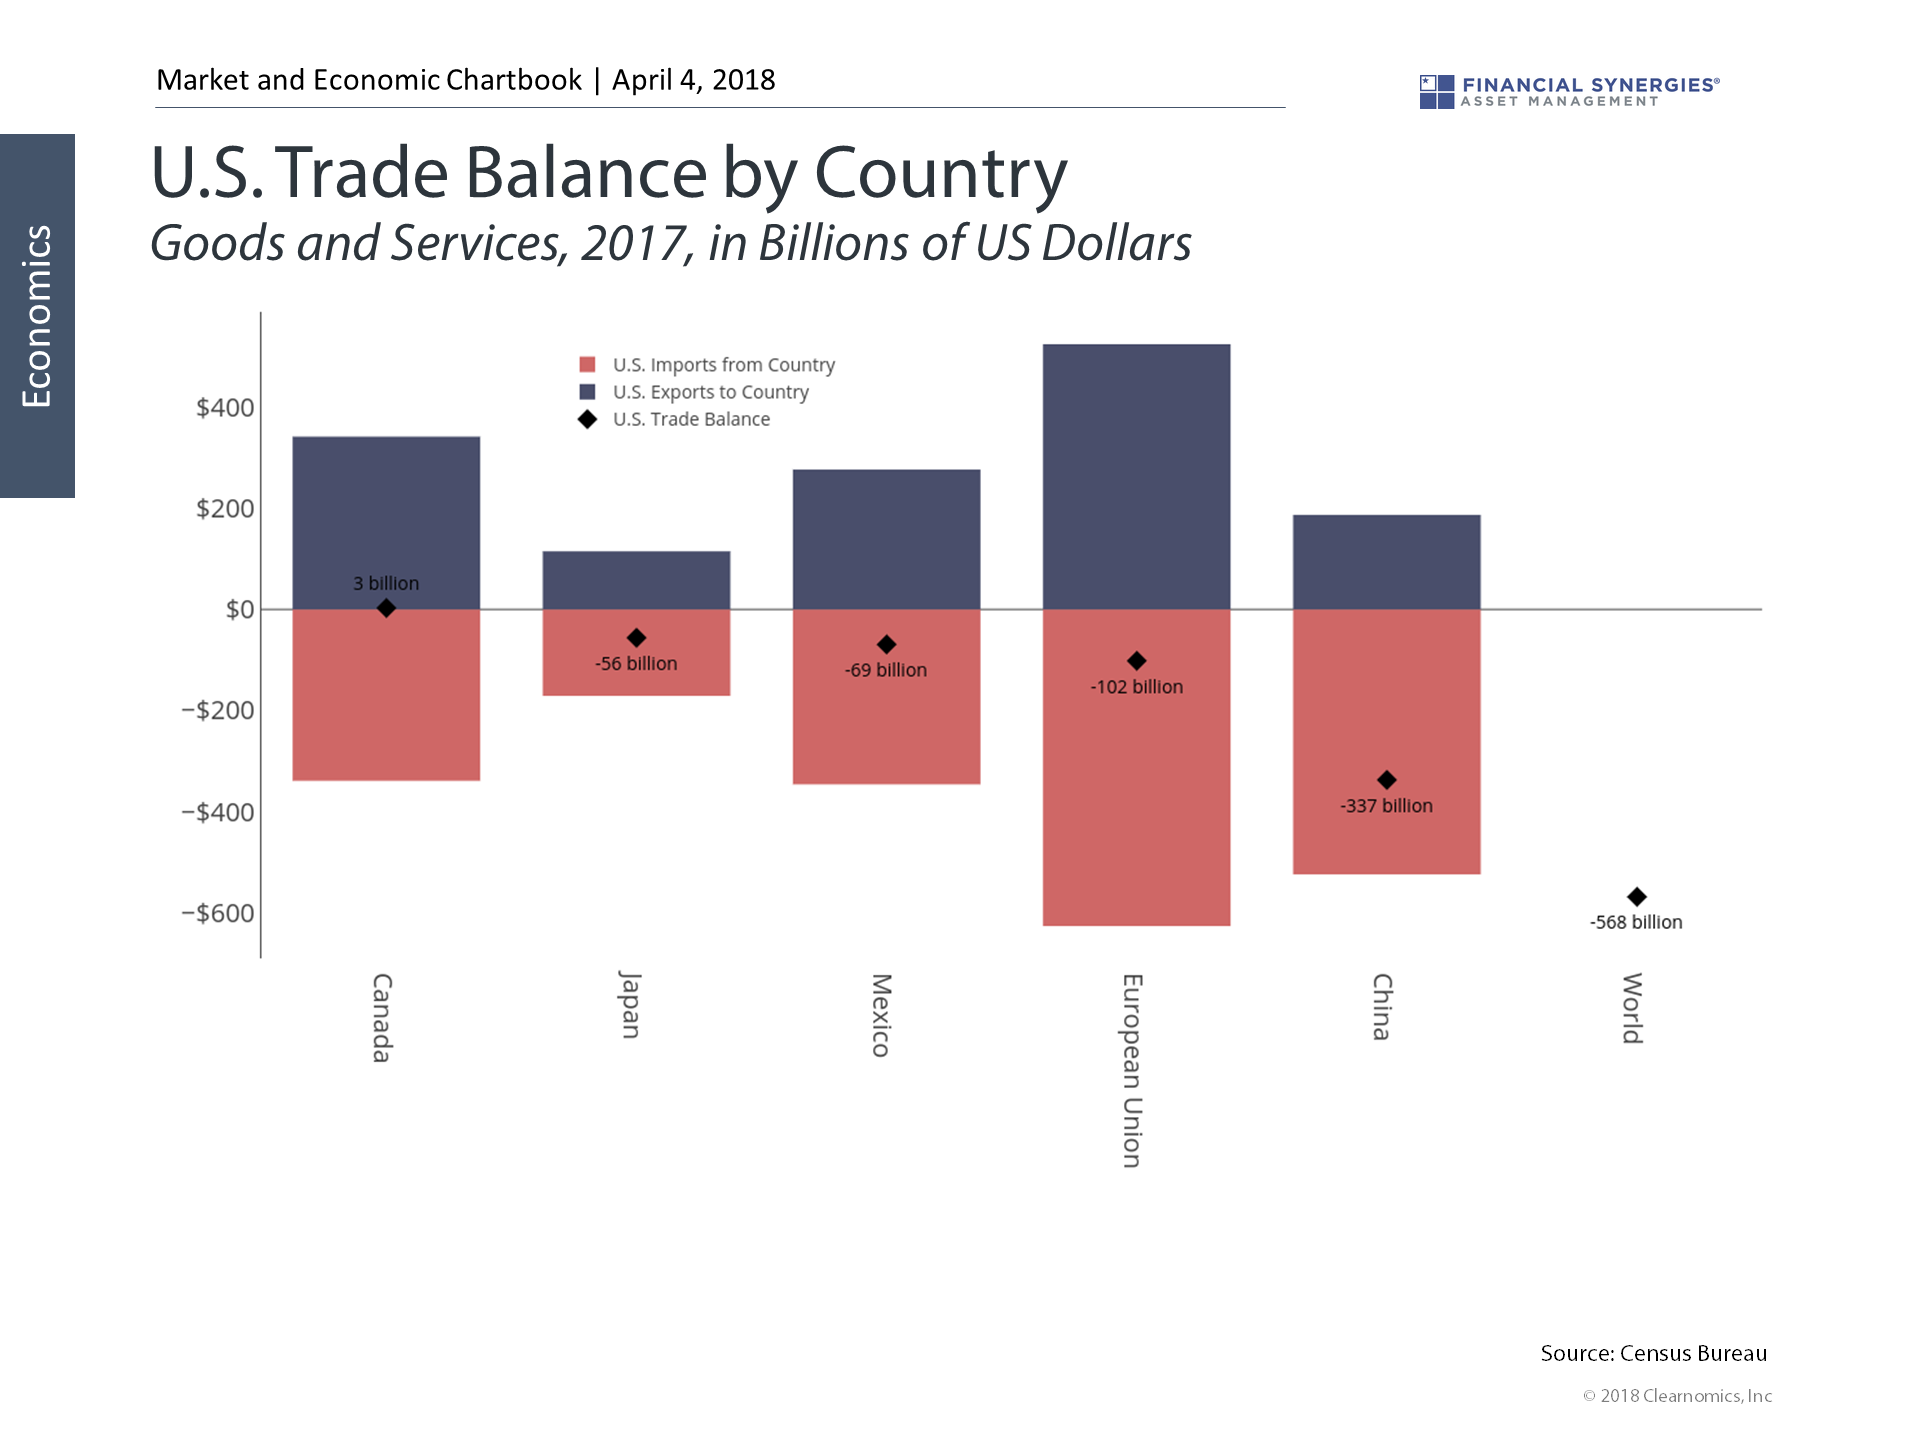
The chart above shows the U.S. trade balance across major trading partners. In 2017, the total U.S. trade deficit reached $568 billion. Countries such as China and Mexico are easy political targets due to our sizable imbalances with these trading partners. However, the U.S. ran significant trade deficits with our other allies as well, including the European Union and Japan. Thus, no country, whether an ally or not, is safe from potential trade renegotiation, resulting in market uncertainty.
2. But volatility is still quite normal
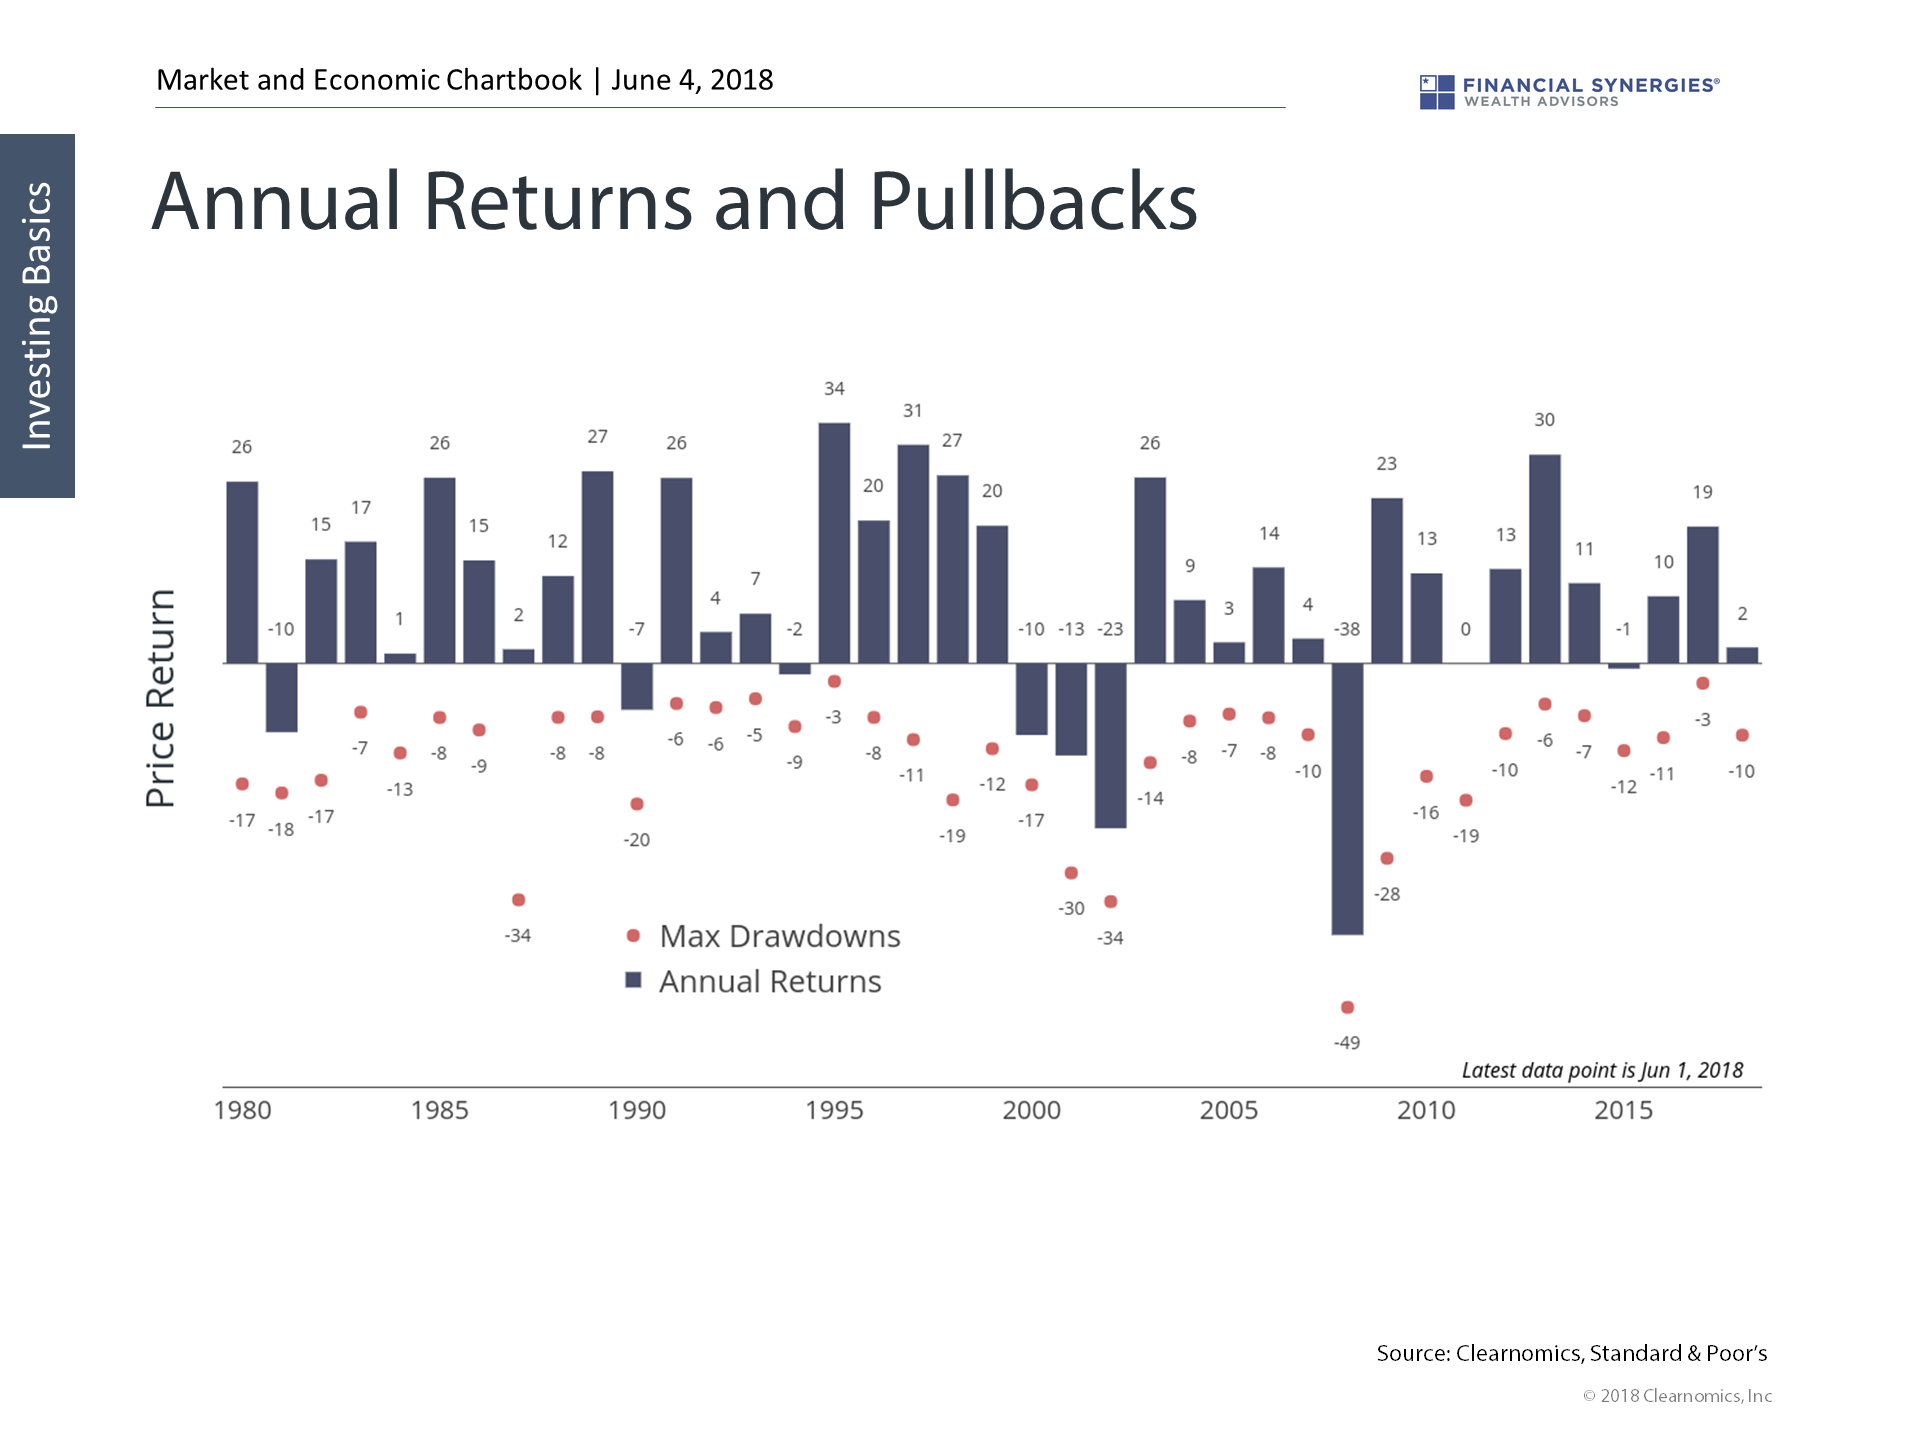
 These factors have led to higher volatility since late January after an extremely quiet 2017. Still, so far in 2018, the worst market pullback has been 10%. While this feels severe after only a 3% max drawdown last year, this is actually below the historical average of 13.5%.
More importantly, despite historical market pullbacks, most years end in positive territory, averaging 9% gains – this is why stocks have historically been great long-run investments, despite short-term turbulence. Volatility is the norm and can only be managed by investing over long time horizons and via diversification, not by trading in and out of the market.
3. The economy is still fundamentally healthy
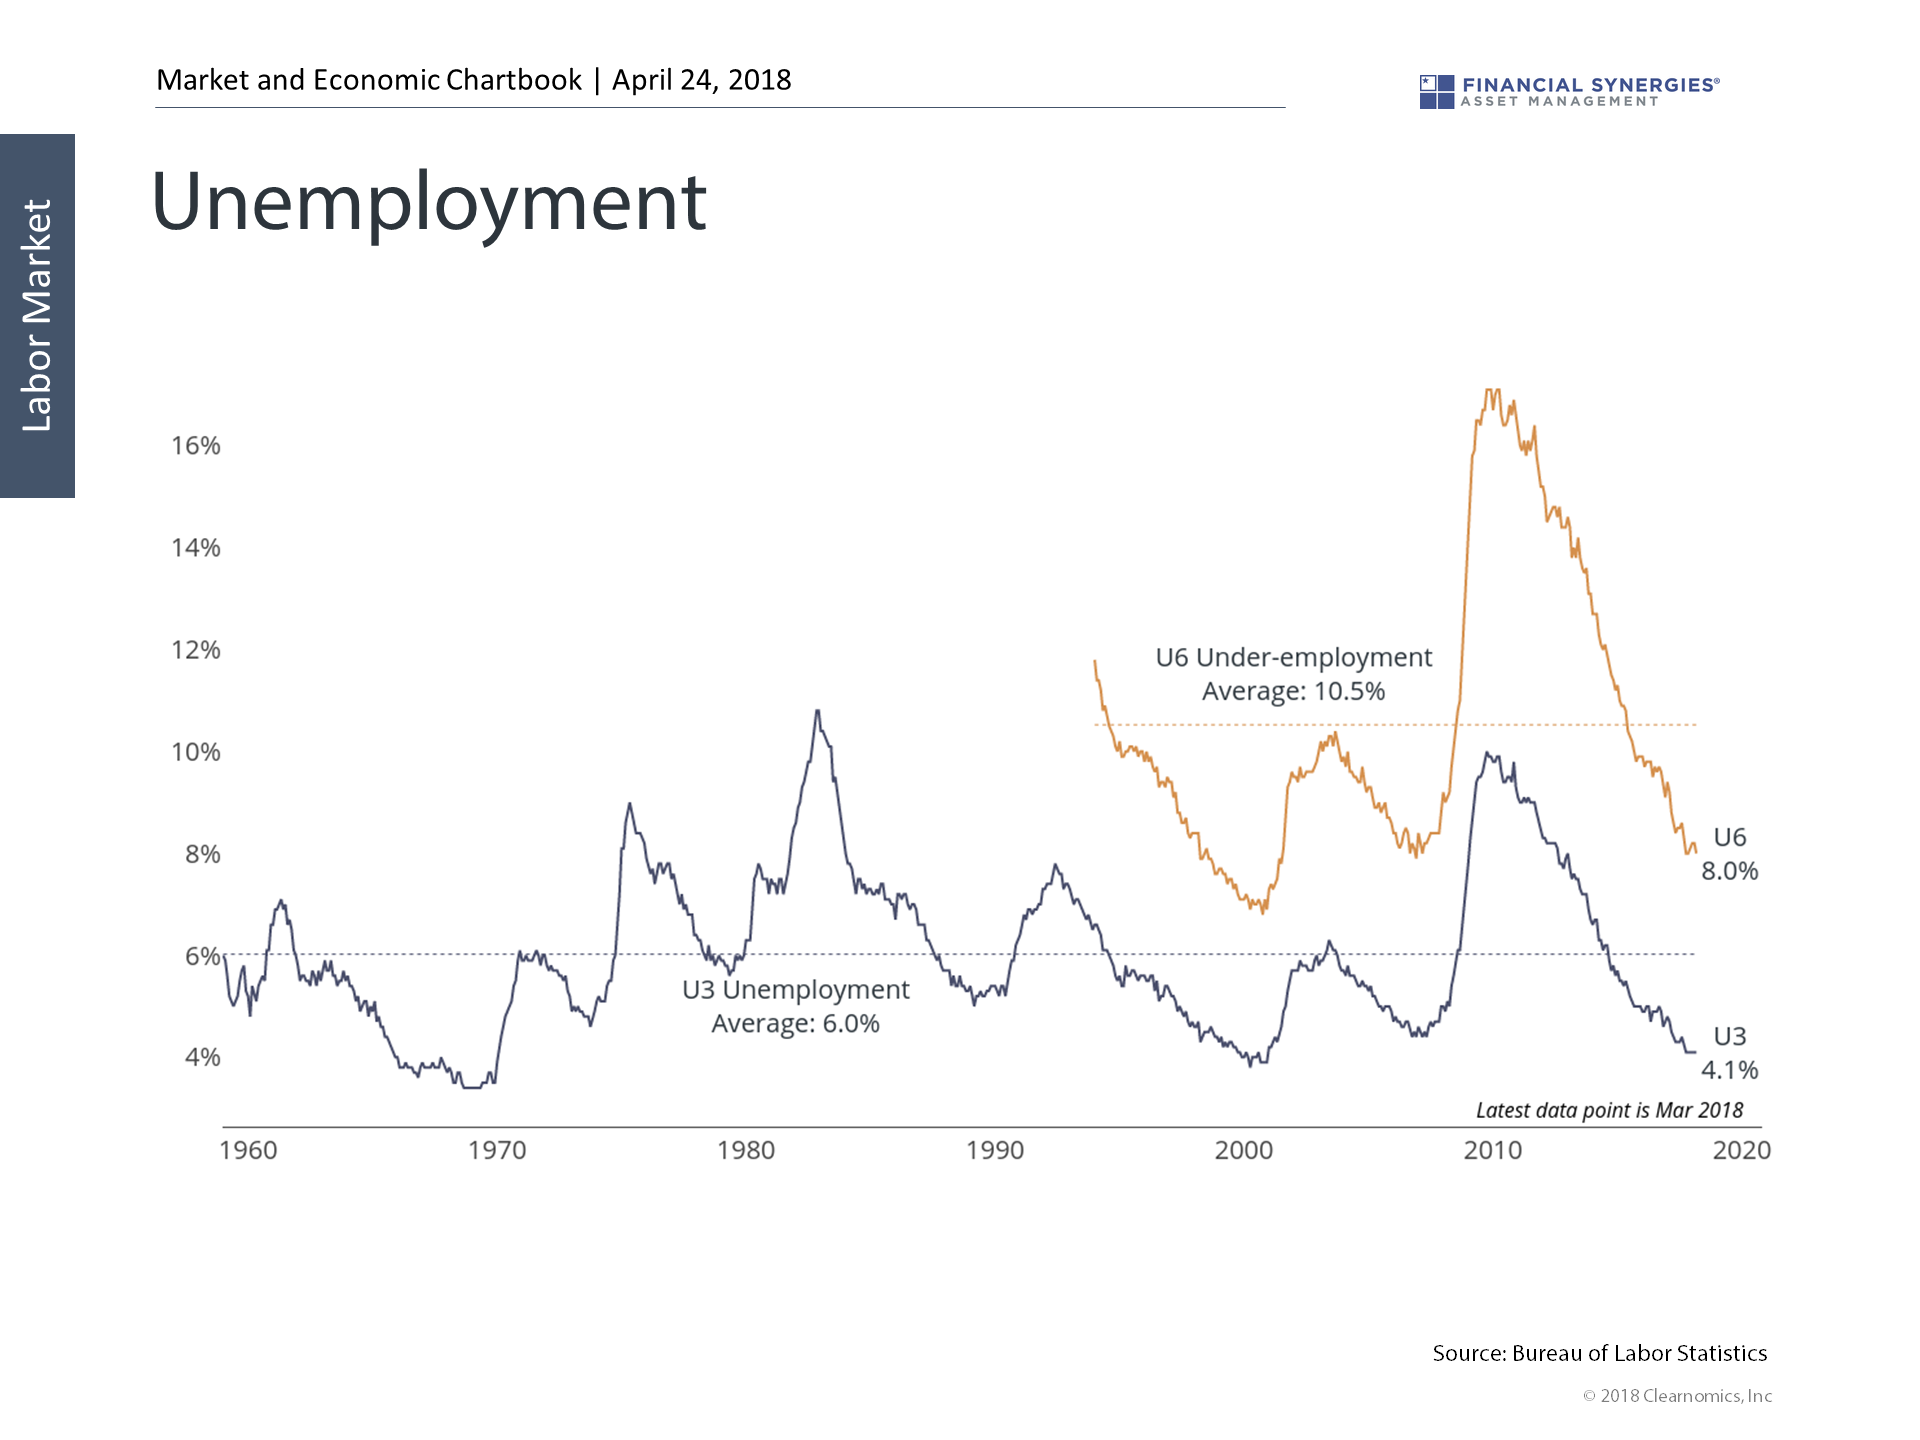
 Despite these international concerns, we learned last Friday that the U.S. unemployment rate fell in May to 3.8%, the lowest level since April 2000. Not since the 1960’s has unemployment been lower. During the housing boom, unemployment reached only as low as 4.4%.
What has muddied the numbers since 2008 is the fact that many workers faced difficulties in the aftermath of the financial crisis. Some were forced to take part-time work while many others dropped out of the labor force altogether. However, the so-called under-employment rate, labeled U6 on the chart above, takes this into account. Even that rate has fallen dramatically in the past nine years and is at its lowest level since 2001.
Thus, at this point in the cycle, the “labor force participation rate” has stabilized. Also, there are over 6.5 million job openings across the country. Clearly, companies would hire if they could find qualified workers. These signs all point to a healthy economy despite short-term risks.
Source: Clearnomics Charts
Understanding Today’s Market
Investors continue to face a wall of worry built on international trade, but reinforced by concerns over Italian banks, relations with North Korea, and more. But even with all these concerns, U.S. stocks overall are positive for the year.
Why have these headlines affected the U.S. market so dramatically since the end of January? As we’ve discussed in the past, over the long run, prices in the stock market are based on both economic fundamentals (i.e. “cash flows”) and perceptions of risk (i.e. the “discount rate”). Last year, the stars aligned on both fronts. Global growth had swung into high gear while perceptions of risk were at historic lows. This resulted in a rapid rise in the stock market with little to no volatility.
But as any long-term investor knows, such low levels of volatility are unsustainable. Concerns that were pushed by the wayside last year have returned to the fore. Thus, the question isn’t what’s driving volatility – it’s whether we’re back to “normal” levels.
The administration’s position on international trade has been known since before the 2016 presidential election. Additionally, the cracks in Italian banks and in other Eurozone fundamentals have been well understood by investors since at least 2010. This is not to diminish the severity of these concerns. Instead, it’s to argue that these are risks that thoughtful investors should price into the market, rather than reasons to jump in and out of the market.
Here are three charts that dive deeper into this important topic:
1. The market is throwing a tariff tantrum
The chart above shows the U.S. trade balance across major trading partners. In 2017, the total U.S. trade deficit reached $568 billion. Countries such as China and Mexico are easy political targets due to our sizable imbalances with these trading partners. However, the U.S. ran significant trade deficits with our other allies as well, including the European Union and Japan. Thus, no country, whether an ally or not, is safe from potential trade renegotiation, resulting in market uncertainty.
2. But volatility is still quite normal
More importantly, despite historical market pullbacks, most years end in positive territory, averaging 9% gains – this is why stocks have historically been great long-run investments, despite short-term turbulence. Volatility is the norm and can only be managed by investing over long time horizons and via diversification, not by trading in and out of the market.
3. The economy is still fundamentally healthy
What has muddied the numbers since 2008 is the fact that many workers faced difficulties in the aftermath of the financial crisis. Some were forced to take part-time work while many others dropped out of the labor force altogether. However, the so-called under-employment rate, labeled U6 on the chart above, takes this into account. Even that rate has fallen dramatically in the past nine years and is at its lowest level since 2001.
Thus, at this point in the cycle, the “labor force participation rate” has stabilized. Also, there are over 6.5 million job openings across the country. Clearly, companies would hire if they could find qualified workers. These signs all point to a healthy economy despite short-term risks.
Source: Clearnomics Charts
Recent Posts
2nd Quarter 2025 Market and Economic Review
The Market Reaches All-Time Highs
Last Week on Wall Street: Broad-Based Market Rally [June 30-2025]
Subscribe to Our Blog
Shareholder | Chief Investment Officer