Monthly Market Update: Stocks Trade Higher as Federal Reserve Signals Rate Cut
👉 For your convenience, we’ve also provided a PDF copy of the Monthly Market Update: Stocks Trade Higher as Federal Reserve Signals Rate Cut.
Monthly Market Summary
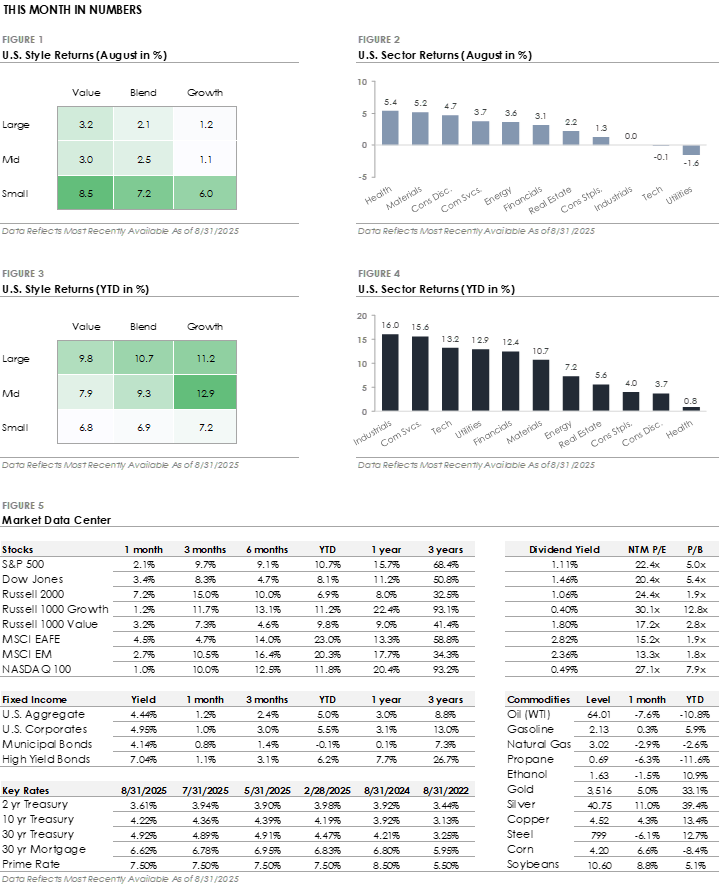
- The S&P 500 Index rose +2.1% in August, bringing its year-to-date return to +10.7%. Large-Cap Value stocks led with a +3.2% gain, while Large-Cap Growth gained +1.2%.
- Health Care was the top-performing sector. Six additional S&P 500 sectors also outperformed the index, while Utilities and Technology both traded lower.
- Bonds traded higher as Treasury yields declined, with the U.S. Bond Aggregate returning +1.2%. Corporate bonds modestly underperformed, with investment-grade posting a +1.0% total return and high-yield gaining +1.1%.
- International stocks outperformed the S&P 500 as the U.S. dollar weakened. Developed Markets gained +4.5%, while Emerging Markets returned +2.7%.
Federal Reserve Prepares to Cut Interest Rates as the Labor Market Softens
The Federal Reserve has kept interest rates unchanged this year due to concerns that tariffs could reignite inflation. This concern, along with strong job growth and low unemployment, gave the central bank time to wait for more data.
However, the Fed’s policy stance was tested in early August when the July jobs report showed U.S. employers added fewer jobs than expected and unemployment rose to 4.2%. The report suggested high borrowing costs are weighing on the economy and shifted the focus from inflation risk to slowing economic growth.
These concerns resurfaced three weeks later at the Fed’s annual Jackson Hole meeting, when Chair Powell acknowledged the balance of risks may warrant a policy adjustment. His comments hinted that a rate cut could come as soon as the Fed’s September 17th meeting. The market quickly connected the dots: a softening labor market made it easier for the Fed to pivot and opened the door to a rate cut. Stocks and bonds traded higher in anticipation that the Fed would resume its interest rate-cutting cycle.
Small-Cap Stocks Post Biggest Month of Outperformance Since November 2024
Small-cap stocks have trailed large caps for most of the past three years. Since the start of 2023, the Russell 2000 index has gained +40%, significantly underperforming the S&P 500’s +75% return. Higher interest rates have weighed more heavily on smaller firms, many of which depend on floating-rate debt to finance their operations and growth. At the same time, a handful of mega-cap tech stocks have delivered strong earnings growth and returns, fueled by the artificial intelligence industry. As investor attention and capital concentrated on these large names, small-caps were left behind, resulting in one of the widest valuation discounts to large-caps in over 20 years.
The soft July jobs report and Chair Powell’s Jackson Hole remarks shifted the market narrative, with investors expecting a rate cut as soon as September. The Russell 2000 jumped more than +7%, its best month this year, and outperformed the S&P 500 by over +5%. Small-caps tend to benefit more from lower interest rates, and rate cut expectations attracted value seekers to small-caps’ valuation discount. This isn’t the first time small-cap stocks have rallied, with recent rallies fading as mega-cap tech reclaimed market leadership. Whether this rotation lasts will depend on upcoming inflation and job reports and how the Fed responds, but small-caps’ recent strength shows investors are once again testing the waters for a small-cap comeback.
Disclosures
The information and opinions provided herein are provided as general market commentary only and are subject to change at any time without notice. This commentary may contain forward-looking statements that are subject to various risks and uncertainties. None of the events or outcomes mentioned here may come to pass, and actual results may differ materially from those expressed or implied in these statements. No mention of a particular security, index, or other instrument in this report constitutes a recommendation to buy, sell, or hold that or any other security, nor does it constitute an opinion on the suitability of any security or index. The report is strictly an informational publication and has been prepared without regard to the particular investments and circumstances of the recipient.
Past performance does not guarantee or indicate future results. Any index performance mentioned is for illustrative purposes only and does not reflect any management fees, transaction costs, or expenses. Indexes are unmanaged, and one cannot invest directly in an index. Index performance does not represent the actual performance that would be achieved by investing in a fund.
Stock performance and fundamental data is based on the following instruments: SPDR S&P 500 ETF (SPY), SPDR Dow Jones ETF (DIA), iShares Russell 2000 ETF (IWM), iShares Russell 1000 Growth ETF (IWF), iShares Russell 1000 Value ETF (IWD), iShares MSCI EAFE ETF (EFA), iShares MSCI Emerging Markets ETF (EEM), Invesco QQQ Trust (QQQ).
Fixed Income performance is based on the following instruments: iShares Core U.S. Aggregate Bond ETF (AGG), iShares Investment Grade Corporate ETF (LQD), iShares National Muni Bond ETF (MUB), iShares High Yield Corporate ETF (HYG).
Fixed Income yields and key rates are based on the following instruments: Bloomberg US Aggregate, ICE BofA US Corporate, ICE BofA US Municipal Securities, ICE BofA US High Yield, 2 Year US Benchmark Bond, 10 Year US Benchmark Bond, 30 Year US Benchmark Bond, 30 Year US Fixed Mortgage Rate, US Prime Rate.
Commodity prices are based on the following instruments: Crude Oil WTI (NYM $/bbl), Gasoline Regular U.S. Gulf Coast ($/gal), Natural Gas (NYM $/mmbtu), Propane (NYM $/gal), Ethanol (CRB $/gallon), Gold (NYM $/ozt), Silver (NYM $/ozt), Copper NYMEX ($/lb), U.S. Midwest Domestic Hot-Rolled Coil Steel (NYM $/st), Corn (CBT $/bu), Soybeans (Chicago $/bu).
U.S. Style performance is based on the following instruments: iShares Russell 1000 Value ETF (IWD), SPDR S&P 500 ETF Trust (SPY), iShares Russell 1000 Growth ETF (IWF), iShares Russell Mid-Cap Value ETF (IWS), iShares Russell Midcap ETF (IWR), iShares Russell Mid-Cap Growth ETF (IWP), iShares Russell 2000 Value ETF (IWN), iShares Russell 2000 ETF (IWM), iShares Russell 2000 Growth ETF (IWO).
U.S. Sector performance is based on the following instruments: Consumer Discretionary Sector SPDR ETF (XLY), Consumer Staples Sector SPDR ETF (XLP), Energy Sector SPDR ETF (XLE), Financial Sector SPDR ETF (XLF), Health Care Sector SPDR ETF (XLV), Industrial Sector SPDR ETF (XLI), Materials Sector SPDR ETF (XLB), Technology Sector SPDR ETF (XLK), Communication Services Sector SPDR ETF (XLC), Utilities Sector SPDR ETF (XLU), Real Estate Sector SPDR ETF (XLRE).
Concerns or questions about how your investment portfolio will hold up in the current market environment? Contact Financial Synergies today.
We are a boutique, financial advisory and total wealth management firm with over 35 years helping clients navigate turbulent markets. To learn more about our approach to investment management please reach out to us. One of our seasoned advisors would be happy to help you build a custom financial plan to help ensure you accomplish your financial goals and objectives. Schedule a conversation with us today.
More relevant articles by Financial Synergies:
Blog Disclosures
This content, which contains security-related opinions and/or information, is provided for informational purposes only and should not be relied upon in any manner as professional advice, or an endorsement of any practices, products or services. There can be no guarantees or assurances that the views expressed here will be applicable for any particular facts or circumstances, and should not be relied upon in any manner. You should consult your own financial advisors as to legal, business, tax, and other related matters concerning any investment.
The commentary in this “post” (including any related blogs, videos, and social media) reflects the personal opinions, viewpoints, and analyses of the Financial Synergies Wealth Advisors, Inc. employees providing such comments, and should not be regarded as the views of Financial Synergies Wealth Advisors, Inc. or its respective affiliates or as a description of advisory services provided by Financial Synergies Wealth Advisors, Inc. or performance returns of any Financial Synergies Wealth Advisors, Inc. client.
Any opinions expressed herein do not constitute or imply endorsement, sponsorship, or recommendation by Financial Synergies Wealth Advisors, Inc. or its employees. The views reflected in the commentary are subject to change at any time without notice.
Nothing on this website constitutes investment or financial planning advice, performance data or any recommendation that any particular security, portfolio of securities, transaction or investment strategy is suitable for any specific person. It also should not be construed as an offer soliciting the purchase or sale of any security mentioned. Nor should it be construed as an offer to provide investment advisory services by Financial Synergies Wealth Advisors, Inc.
Any mention of a particular security and related performance data is not a recommendation to buy or sell that security. Financial Synergies Wealth Advisors, Inc. manages its clients’ accounts using a variety of investment techniques and strategies, which are not necessarily discussed in the commentary. Investments in securities involve the risk of loss. Past performance is no guarantee of future results.
Any charts provided here or on any related Financial Synergies Wealth Advisors, Inc. personnel content outlets are for informational purposes only, and should also not be relied upon when making any investment decision. Any indices referenced for comparison are unmanaged and cannot be invested into directly. As always please remember investing involves risk and possible loss of principal capital; please seek advice from a licensed professional. Any projections, estimates, forecasts, targets, prospects and/or opinions expressed in these materials are subject to change without notice and may differ or be contrary to opinions expressed by others. Information in charts have been obtained from third-party sources and data, and may include those from portfolio securities of funds managed by Financial Synergies Wealth Advisors, Inc. While taken from sources believed to be reliable, Financial Synergies Wealth Advisors, Inc. has not independently verified such information and makes no representations about the enduring accuracy of the information or its appropriateness for a given situation. All content speaks only as of the date indicated.
Financial Synergies Wealth Advisors, Inc. is a registered investment adviser. Advisory services are only offered to clients or prospective clients where Financial Synergies Wealth Advisors, Inc. and its representatives are properly licensed or exempt from licensure. Investments in securities involve the risk of loss. Past performance is no guarantee of future results.
See Full Disclosures Page Here
Monthly Market Update: Stocks Trade Higher as Federal Reserve Signals Rate Cut
Monthly Market Update: Stocks Trade Higher as Federal Reserve Signals Rate Cut
👉 For your convenience, we’ve also provided a PDF copy of the Monthly Market Update: Stocks Trade Higher as Federal Reserve Signals Rate Cut.
Monthly Market Summary
Federal Reserve Prepares to Cut Interest Rates as the Labor Market Softens
The Federal Reserve has kept interest rates unchanged this year due to concerns that tariffs could reignite inflation. This concern, along with strong job growth and low unemployment, gave the central bank time to wait for more data.
However, the Fed’s policy stance was tested in early August when the July jobs report showed U.S. employers added fewer jobs than expected and unemployment rose to 4.2%. The report suggested high borrowing costs are weighing on the economy and shifted the focus from inflation risk to slowing economic growth.
These concerns resurfaced three weeks later at the Fed’s annual Jackson Hole meeting, when Chair Powell acknowledged the balance of risks may warrant a policy adjustment. His comments hinted that a rate cut could come as soon as the Fed’s September 17th meeting. The market quickly connected the dots: a softening labor market made it easier for the Fed to pivot and opened the door to a rate cut. Stocks and bonds traded higher in anticipation that the Fed would resume its interest rate-cutting cycle.
Small-Cap Stocks Post Biggest Month of Outperformance Since November 2024
Small-cap stocks have trailed large caps for most of the past three years. Since the start of 2023, the Russell 2000 index has gained +40%, significantly underperforming the S&P 500’s +75% return. Higher interest rates have weighed more heavily on smaller firms, many of which depend on floating-rate debt to finance their operations and growth. At the same time, a handful of mega-cap tech stocks have delivered strong earnings growth and returns, fueled by the artificial intelligence industry. As investor attention and capital concentrated on these large names, small-caps were left behind, resulting in one of the widest valuation discounts to large-caps in over 20 years.
The soft July jobs report and Chair Powell’s Jackson Hole remarks shifted the market narrative, with investors expecting a rate cut as soon as September. The Russell 2000 jumped more than +7%, its best month this year, and outperformed the S&P 500 by over +5%. Small-caps tend to benefit more from lower interest rates, and rate cut expectations attracted value seekers to small-caps’ valuation discount. This isn’t the first time small-cap stocks have rallied, with recent rallies fading as mega-cap tech reclaimed market leadership. Whether this rotation lasts will depend on upcoming inflation and job reports and how the Fed responds, but small-caps’ recent strength shows investors are once again testing the waters for a small-cap comeback.
Disclosures
The information and opinions provided herein are provided as general market commentary only and are subject to change at any time without notice. This commentary may contain forward-looking statements that are subject to various risks and uncertainties. None of the events or outcomes mentioned here may come to pass, and actual results may differ materially from those expressed or implied in these statements. No mention of a particular security, index, or other instrument in this report constitutes a recommendation to buy, sell, or hold that or any other security, nor does it constitute an opinion on the suitability of any security or index. The report is strictly an informational publication and has been prepared without regard to the particular investments and circumstances of the recipient.
Past performance does not guarantee or indicate future results. Any index performance mentioned is for illustrative purposes only and does not reflect any management fees, transaction costs, or expenses. Indexes are unmanaged, and one cannot invest directly in an index. Index performance does not represent the actual performance that would be achieved by investing in a fund.
Stock performance and fundamental data is based on the following instruments: SPDR S&P 500 ETF (SPY), SPDR Dow Jones ETF (DIA), iShares Russell 2000 ETF (IWM), iShares Russell 1000 Growth ETF (IWF), iShares Russell 1000 Value ETF (IWD), iShares MSCI EAFE ETF (EFA), iShares MSCI Emerging Markets ETF (EEM), Invesco QQQ Trust (QQQ).
Fixed Income performance is based on the following instruments: iShares Core U.S. Aggregate Bond ETF (AGG), iShares Investment Grade Corporate ETF (LQD), iShares National Muni Bond ETF (MUB), iShares High Yield Corporate ETF (HYG).
Fixed Income yields and key rates are based on the following instruments: Bloomberg US Aggregate, ICE BofA US Corporate, ICE BofA US Municipal Securities, ICE BofA US High Yield, 2 Year US Benchmark Bond, 10 Year US Benchmark Bond, 30 Year US Benchmark Bond, 30 Year US Fixed Mortgage Rate, US Prime Rate.
Commodity prices are based on the following instruments: Crude Oil WTI (NYM $/bbl), Gasoline Regular U.S. Gulf Coast ($/gal), Natural Gas (NYM $/mmbtu), Propane (NYM $/gal), Ethanol (CRB $/gallon), Gold (NYM $/ozt), Silver (NYM $/ozt), Copper NYMEX ($/lb), U.S. Midwest Domestic Hot-Rolled Coil Steel (NYM $/st), Corn (CBT $/bu), Soybeans (Chicago $/bu).
U.S. Style performance is based on the following instruments: iShares Russell 1000 Value ETF (IWD), SPDR S&P 500 ETF Trust (SPY), iShares Russell 1000 Growth ETF (IWF), iShares Russell Mid-Cap Value ETF (IWS), iShares Russell Midcap ETF (IWR), iShares Russell Mid-Cap Growth ETF (IWP), iShares Russell 2000 Value ETF (IWN), iShares Russell 2000 ETF (IWM), iShares Russell 2000 Growth ETF (IWO).
U.S. Sector performance is based on the following instruments: Consumer Discretionary Sector SPDR ETF (XLY), Consumer Staples Sector SPDR ETF (XLP), Energy Sector SPDR ETF (XLE), Financial Sector SPDR ETF (XLF), Health Care Sector SPDR ETF (XLV), Industrial Sector SPDR ETF (XLI), Materials Sector SPDR ETF (XLB), Technology Sector SPDR ETF (XLK), Communication Services Sector SPDR ETF (XLC), Utilities Sector SPDR ETF (XLU), Real Estate Sector SPDR ETF (XLRE).
Concerns or questions about how your investment portfolio will hold up in the current market environment? Contact Financial Synergies today.
We are a boutique, financial advisory and total wealth management firm with over 35 years helping clients navigate turbulent markets. To learn more about our approach to investment management please reach out to us. One of our seasoned advisors would be happy to help you build a custom financial plan to help ensure you accomplish your financial goals and objectives. Schedule a conversation with us today.
More relevant articles by Financial Synergies:
Blog Disclosures
This content, which contains security-related opinions and/or information, is provided for informational purposes only and should not be relied upon in any manner as professional advice, or an endorsement of any practices, products or services. There can be no guarantees or assurances that the views expressed here will be applicable for any particular facts or circumstances, and should not be relied upon in any manner. You should consult your own financial advisors as to legal, business, tax, and other related matters concerning any investment.
The commentary in this “post” (including any related blogs, videos, and social media) reflects the personal opinions, viewpoints, and analyses of the Financial Synergies Wealth Advisors, Inc. employees providing such comments, and should not be regarded as the views of Financial Synergies Wealth Advisors, Inc. or its respective affiliates or as a description of advisory services provided by Financial Synergies Wealth Advisors, Inc. or performance returns of any Financial Synergies Wealth Advisors, Inc. client.
Any opinions expressed herein do not constitute or imply endorsement, sponsorship, or recommendation by Financial Synergies Wealth Advisors, Inc. or its employees. The views reflected in the commentary are subject to change at any time without notice.
Nothing on this website constitutes investment or financial planning advice, performance data or any recommendation that any particular security, portfolio of securities, transaction or investment strategy is suitable for any specific person. It also should not be construed as an offer soliciting the purchase or sale of any security mentioned. Nor should it be construed as an offer to provide investment advisory services by Financial Synergies Wealth Advisors, Inc.
Any mention of a particular security and related performance data is not a recommendation to buy or sell that security. Financial Synergies Wealth Advisors, Inc. manages its clients’ accounts using a variety of investment techniques and strategies, which are not necessarily discussed in the commentary. Investments in securities involve the risk of loss. Past performance is no guarantee of future results.
Any charts provided here or on any related Financial Synergies Wealth Advisors, Inc. personnel content outlets are for informational purposes only, and should also not be relied upon when making any investment decision. Any indices referenced for comparison are unmanaged and cannot be invested into directly. As always please remember investing involves risk and possible loss of principal capital; please seek advice from a licensed professional. Any projections, estimates, forecasts, targets, prospects and/or opinions expressed in these materials are subject to change without notice and may differ or be contrary to opinions expressed by others. Information in charts have been obtained from third-party sources and data, and may include those from portfolio securities of funds managed by Financial Synergies Wealth Advisors, Inc. While taken from sources believed to be reliable, Financial Synergies Wealth Advisors, Inc. has not independently verified such information and makes no representations about the enduring accuracy of the information or its appropriateness for a given situation. All content speaks only as of the date indicated.
Financial Synergies Wealth Advisors, Inc. is a registered investment adviser. Advisory services are only offered to clients or prospective clients where Financial Synergies Wealth Advisors, Inc. and its representatives are properly licensed or exempt from licensure. Investments in securities involve the risk of loss. Past performance is no guarantee of future results.
See Full Disclosures Page Here
Recent Posts
Weekly Market Recap | Nov. 21, 2025
Chart of the Month | S&P 500 Sets More Than 35 New Highs for Second Consecutive Year
Using Structured Notes for Enhanced Income, Protection, and Better Planning
Subscribe to Our Blog
Shareholder | Chief Investment Officer