As markets reach new highs and artificial intelligence stocks continue to rally, some investors are asking, “Are we in an AI-driven bubble?” This is as much about investor psychology as it is about market conditions. While it’s normal to worry about bubbles, focusing too much on them can lead to counterproductive portfolio decisions that prioritize timing and short-term trading rather than long-term financial goals.
The concept of a “bubble” is often taken for granted when we talk about financial markets, but it’s actually quite hard to define what the term means. Markets naturally experience cycles, and how investors perceive risk changes over time. For every example of a bubble – including the late 1990s dot-com era and the mid-2000s housing boom – there are countless other situations when investor concerns never materialized. For example, investors constantly worried about additional bubbles after the 2008 financial crisis, only for this period to become the longest bull market on record.
So, the question of whether we are in a bubble should be distinguished from “will the stock market experience a setback?” As investors have learned from the past several years, short-term stock market declines are not only normal, but expected, and can occur without warning. Just earlier this year, the S&P 500 declined 19% but bounced back in less than three months. Many who tried to time the market during this period likely found themselves on the sidelines as the market recovered.
While the past is no guarantee of the future, the stock market has consistently made significant gains throughout history, despite periodic challenges. In this uncertain environment, how can we stay focused on building portfolios that align with our financial plans?
Valuations are high but there are important factors to keep in mind
To distinguish between short-term pullbacks and the fear of a potential bubble, it’s important to consider the concept of value. As with everything in life, what matters in investing isn’t just what price you pay but what you get for your money. After all, the reason investors buy stocks is to own a part of a business and its cash flows. Valuation metrics such as price-to-sales or price-to-earnings tell us not just the price of a share, but what we’re getting for that price.
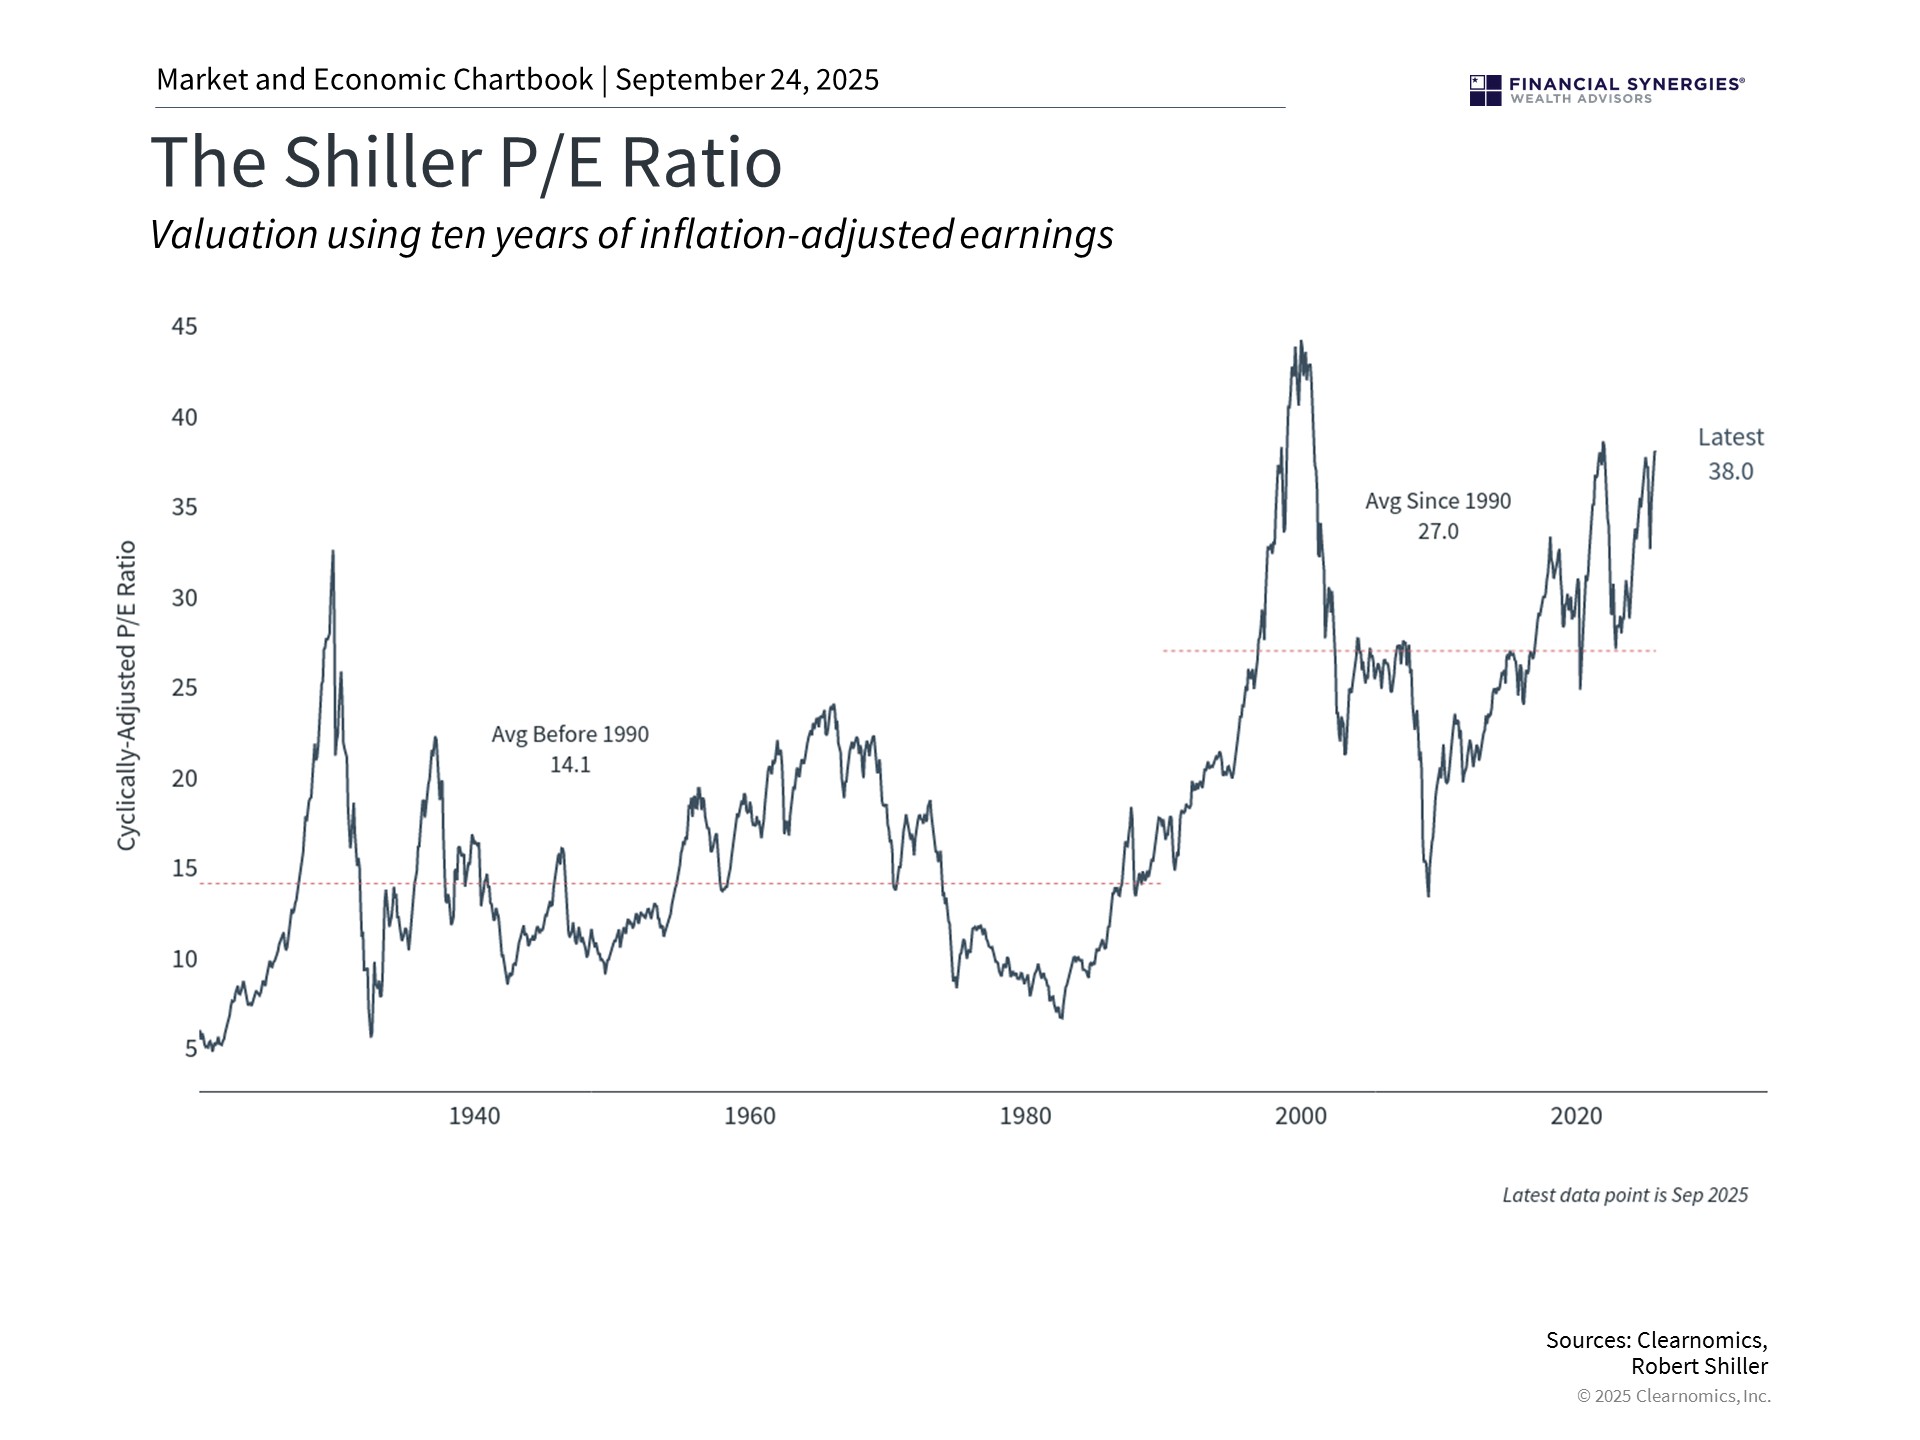
The accompanying chart shows the Shiller price-to-earnings ratio which provides perspective on long-term valuation trends by using inflation-adjusted earnings over the past ten years. The current level of 38x, which means that investors are paying $38 for each dollar of historical earnings today, is well above the average of 27x. This has fluctuated over the past few years as markets have navigated inflation, policy uncertainty, and volatility in technology stocks.
With many measures showing that the stock market is expensive by historical standards, there are a few key points for investors to keep in mind.
First, it’s important to emphasize that valuations do not reliably predict stock market returns in the near term. Instead, they tell us how much investors are willing to pay based on their expectations about the future. Even when stocks appear expensive, markets can continue rising for months or years if business fundamentals remain strong. This is why trying to time the market can often be counterproductive.
Second, while there are parallels to the 1990s tech boom since both periods feature high valuations and excitement around new technologies, there are some key differences. Unlike the unprofitable dot-com companies of the past, current market leaders are well established, have strong profitability, and healthy balance sheets. Just as the information technology revolution ultimately benefited all types of companies over the past few decades, so too could developments in artificial intelligence.
Third, not all bubbles “pop.” While valuations can come back to Earth if prices fall, they can also improve if earnings and other fundamentals remain strong. Some of the enthusiasm experienced by the market today is in anticipation of higher future earnings. Corporate performance has justified some of these expectations in recent quarters with earnings growth coming in stronger than many had anticipated.
Opportunities exist across a range of styles and sizes
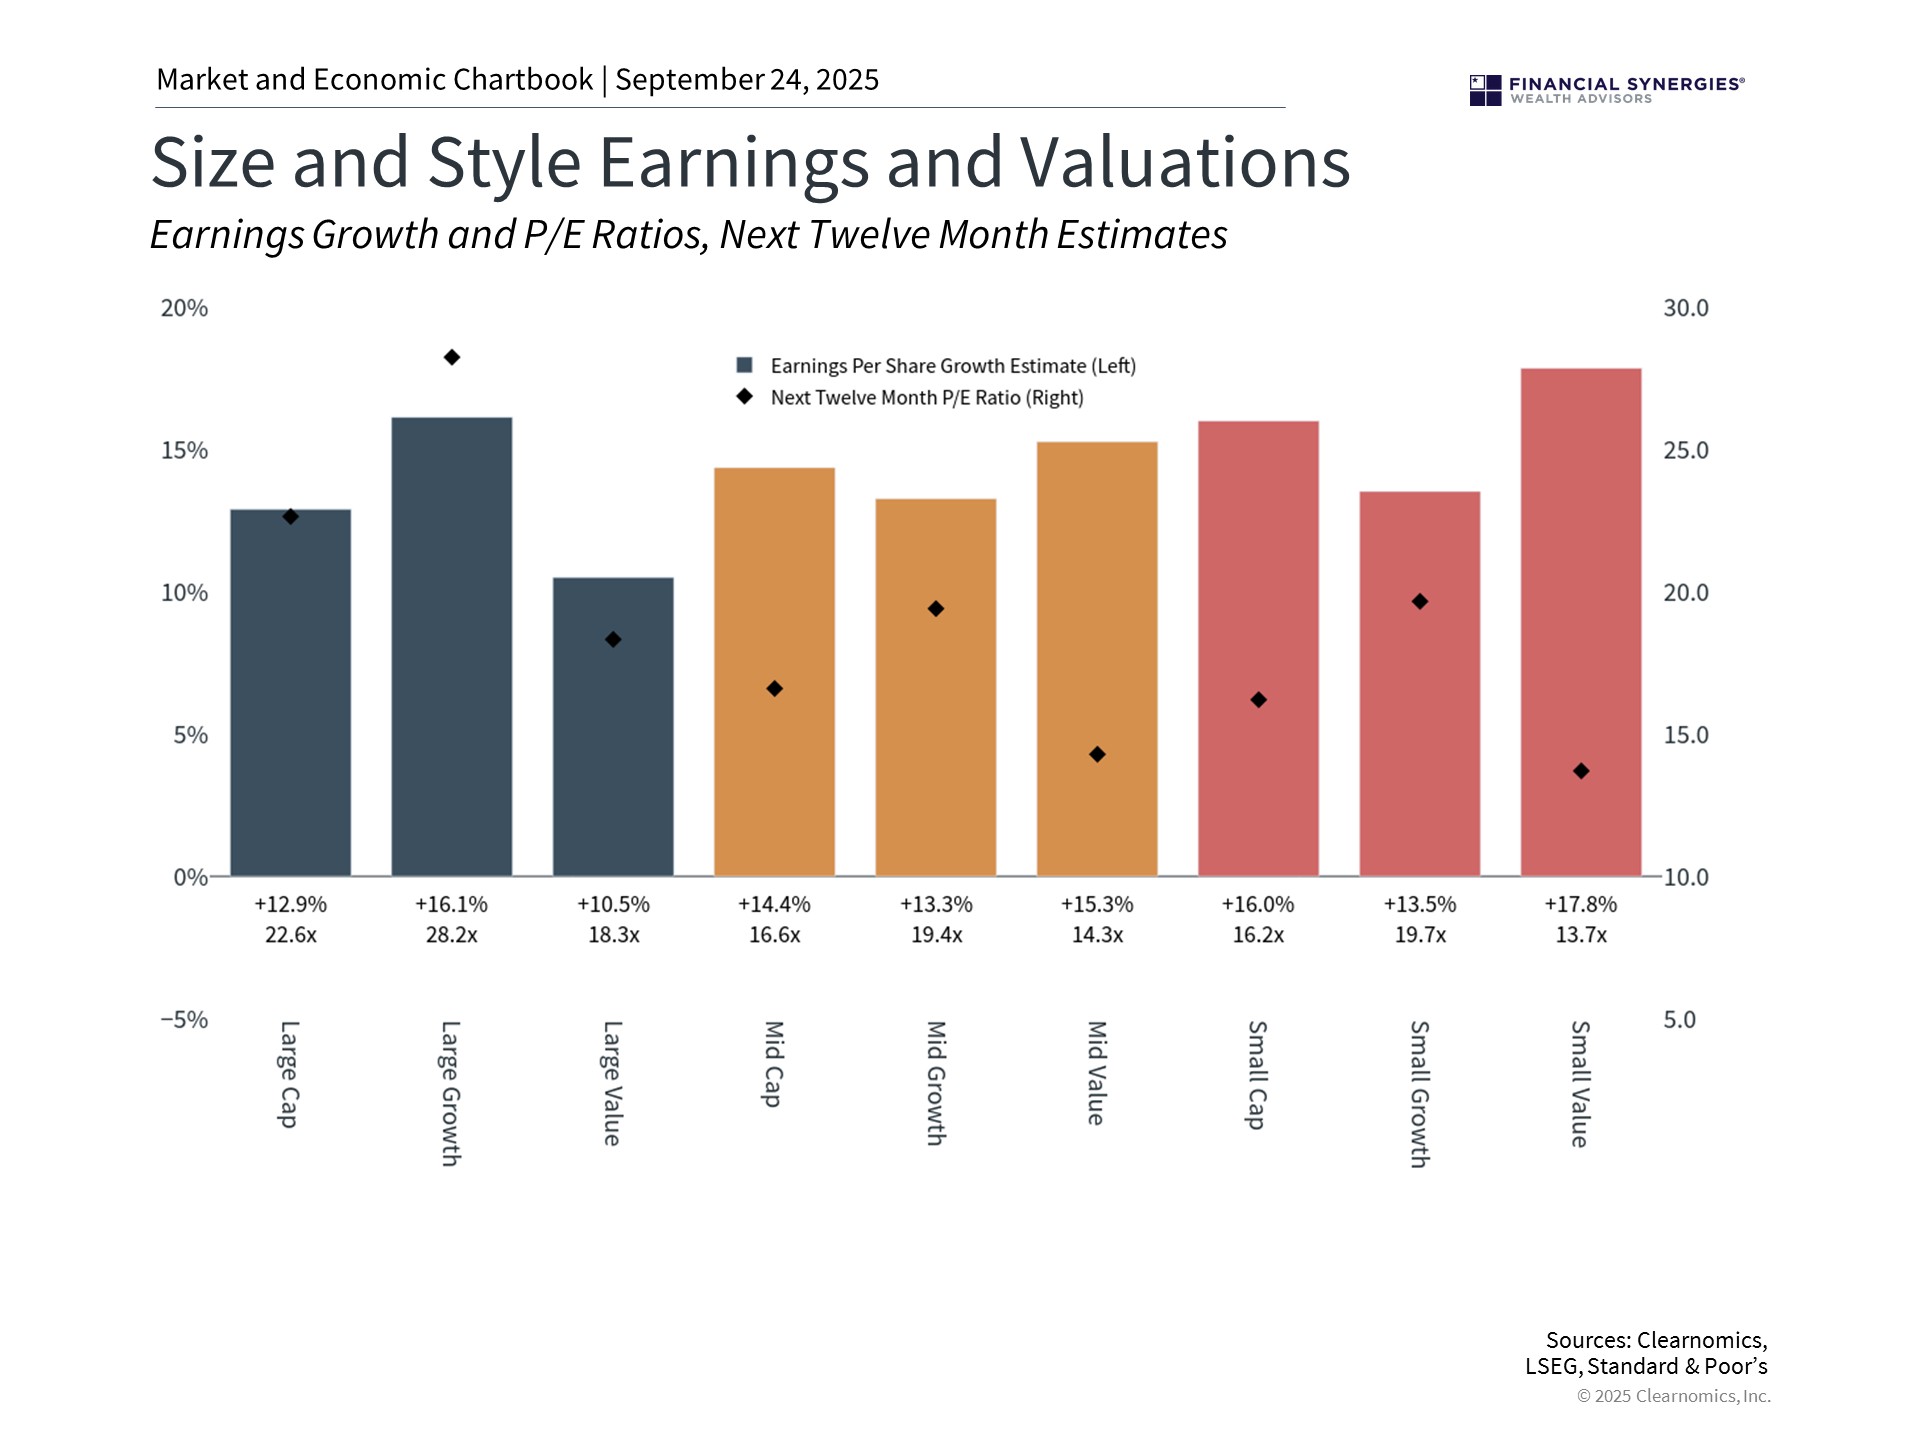
While valuations for the broad market are elevated, there are other areas that are more attractive. As the accompanying chart above shows, the price-to-earnings ratio for Large Cap Growth stocks is the highest at 28x. Other stock market sizes and styles, including Large Value and Small Caps, have more attractive valuations, even as they continue to experience healthy earnings growth.
This is true across stock market sectors as well. Artificial intelligence-related companies are primarily concentrated in the Information Technology, Communication Services, and Consumer Discretionary sectors. In recent quarters, positive trends have broadened to other sectors with more attractive valuations too, including Financials, Industrials, and more.
For investors, including a range of sizes, styles, and sectors in a portfolio not only helps reduce “concentration risk,” but can improve the overall valuations of holdings to better manage risk. It’s difficult to predict exactly which areas of the market will outperform over any given period, so holding an appropriate mix can help to improve portfolio balance.
Time remains one of the most powerful investment tools
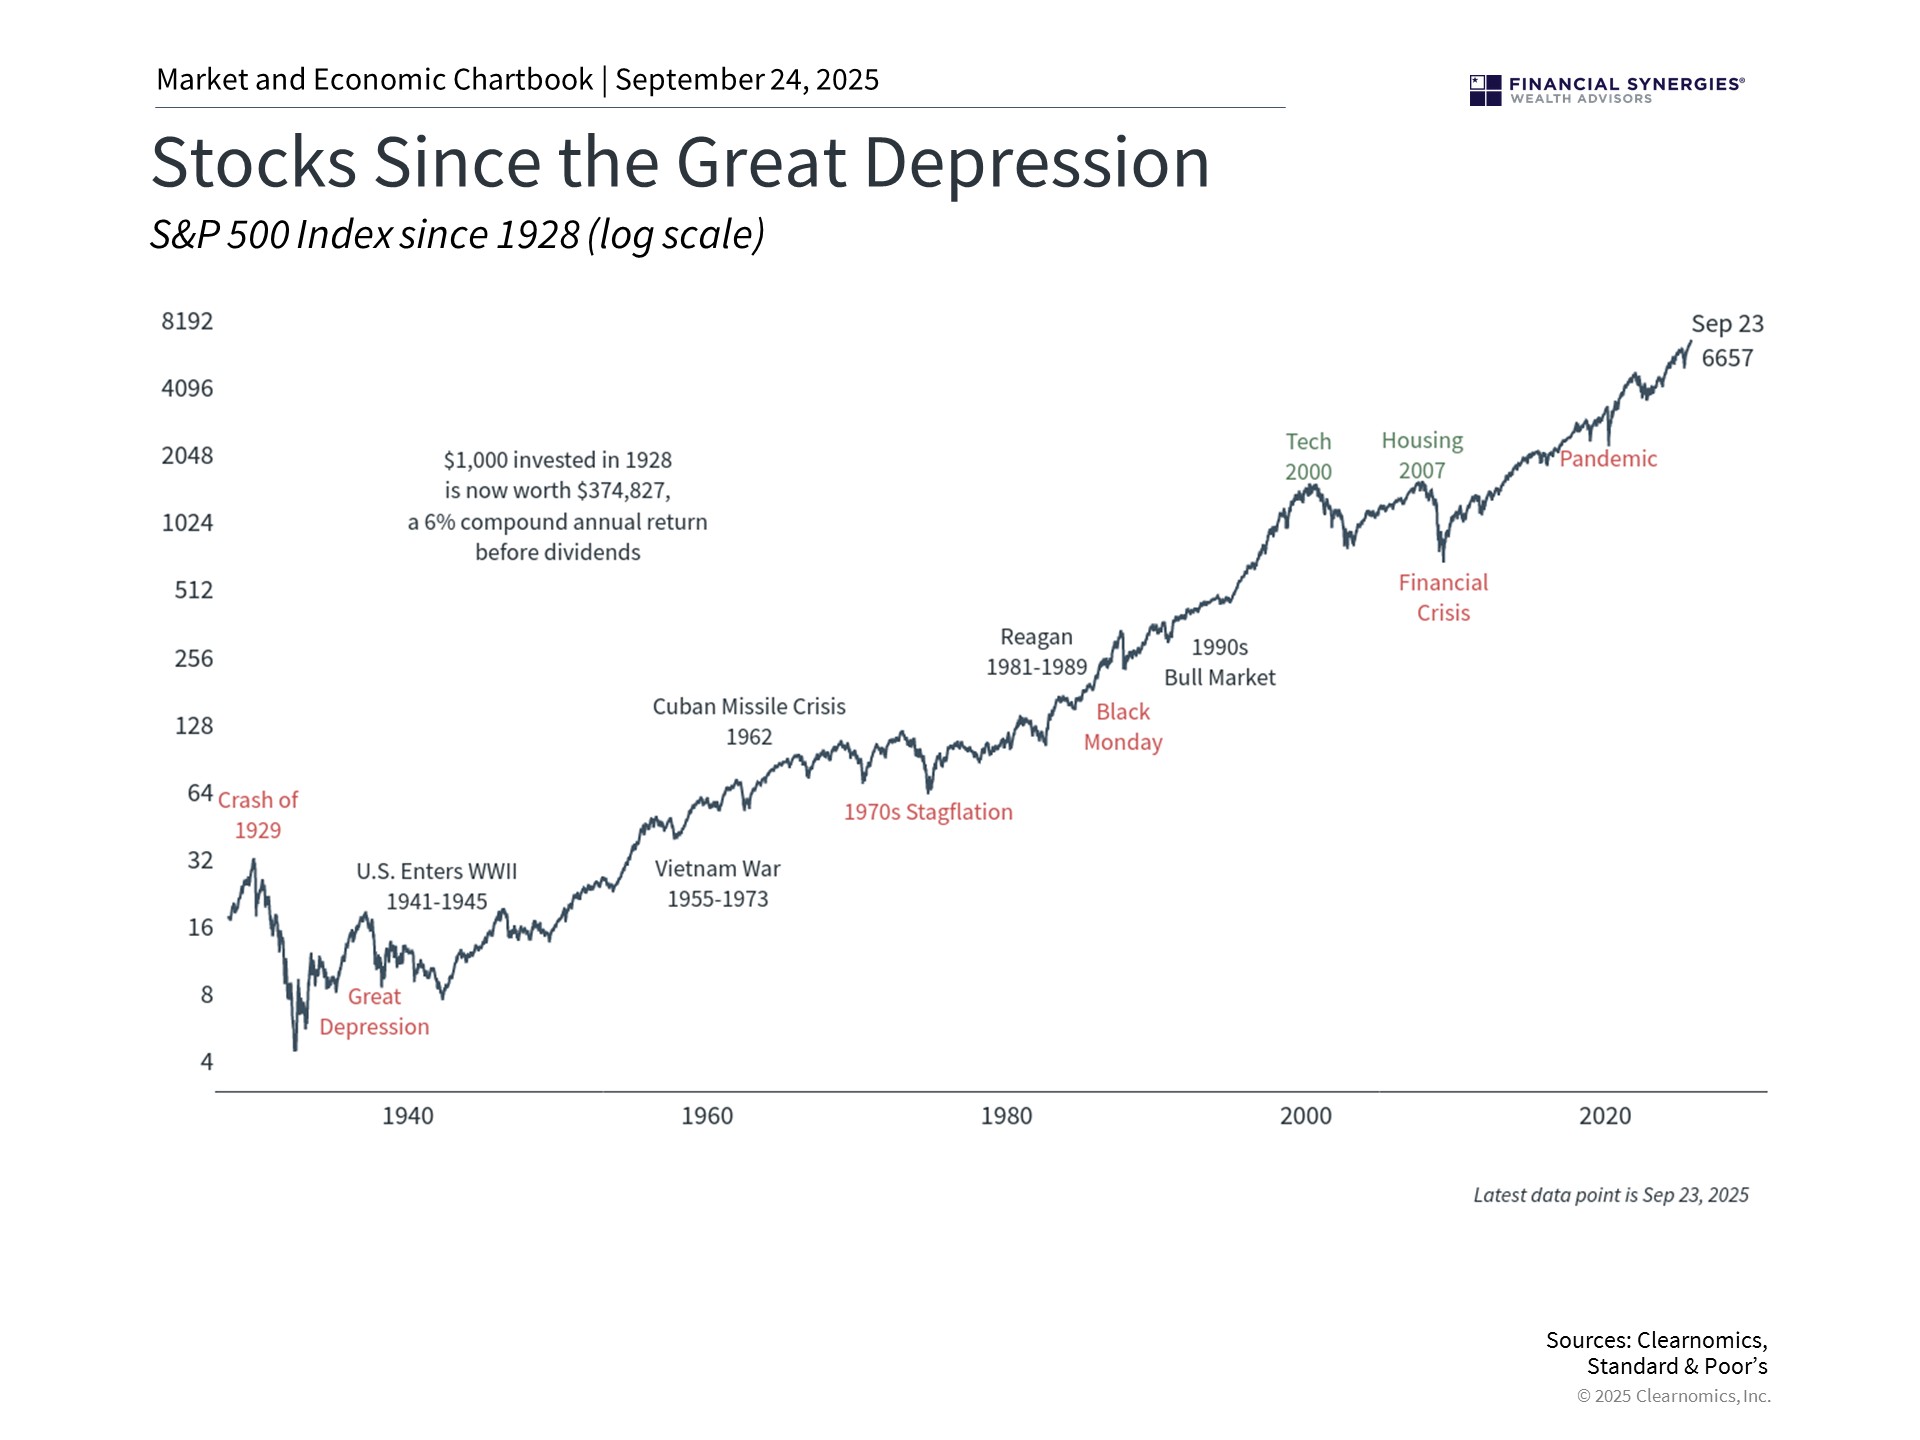
Perhaps the most important lesson from market history is that time tends to reward patient investors, even those who invest throughout periods of high valuations. As the chart above shows, some of the most impactful market events appear less dramatic when zooming out over years and decades – time horizons that are appropriate for many investors’ financial goals. For instance, the tech and housing bubbles, while challenging at the time, both experienced recoveries as the market rose to new all-time highs.
This emphasizes the importance of not only portfolio positioning, but investment concepts that take advantage of longer timeframes such as dollar cost averaging. Even those who invested at the worst points in history, such as the 1929 market peak before the Great Depression, achieved positive returns over time. Starting during lower valuations generally produces better returns, but this advantage diminishes over extended time horizons.
Concerns over a “bubble” have grown as the market continues to reach new all-time highs, and technology stocks continue to grow in importance. Rather than focusing on what this means for the market in the short run, consider historical lessons and how they impact long-term portfolios.
The bottom line? Today’s market valuations are high due to strong earnings and business fundamentals. The key is maintaining a diversified portfolio that can benefit from growth while managing risk.
Concerns or questions about how your investment portfolio will hold up in the current market environment? Contact Financial Synergies today.
We are a boutique, financial advisory and total wealth management firm with over 35 years helping clients navigate turbulent markets. To learn more about our approach to investment management please reach out to us. One of our seasoned advisors would be happy to help you build a custom financial plan to help ensure you accomplish your financial goals and objectives. Schedule a conversation with us today.
More relevant articles by Financial Synergies:
Blog Disclosures
This content, which contains security-related opinions and/or information, is provided for informational purposes only and should not be relied upon in any manner as professional advice, or an endorsement of any practices, products or services. There can be no guarantees or assurances that the views expressed here will be applicable for any particular facts or circumstances, and should not be relied upon in any manner. You should consult your own financial advisors as to legal, business, tax, and other related matters concerning any investment.
The commentary in this “post” (including any related blogs, videos, and social media) reflects the personal opinions, viewpoints, and analyses of the Financial Synergies Wealth Advisors, Inc. employees providing such comments, and should not be regarded as the views of Financial Synergies Wealth Advisors, Inc. or its respective affiliates or as a description of advisory services provided by Financial Synergies Wealth Advisors, Inc. or performance returns of any Financial Synergies Wealth Advisors, Inc. client.
Any opinions expressed herein do not constitute or imply endorsement, sponsorship, or recommendation by Financial Synergies Wealth Advisors, Inc. or its employees. The views reflected in the commentary are subject to change at any time without notice.
Nothing on this website constitutes investment or financial planning advice, performance data or any recommendation that any particular security, portfolio of securities, transaction or investment strategy is suitable for any specific person. It also should not be construed as an offer soliciting the purchase or sale of any security mentioned. Nor should it be construed as an offer to provide investment advisory services by Financial Synergies Wealth Advisors, Inc.
Any mention of a particular security and related performance data is not a recommendation to buy or sell that security. Financial Synergies Wealth Advisors, Inc. manages its clients’ accounts using a variety of investment techniques and strategies, which are not necessarily discussed in the commentary. Investments in securities involve the risk of loss. Past performance is no guarantee of future results.
Any charts provided here or on any related Financial Synergies Wealth Advisors, Inc. personnel content outlets are for informational purposes only, and should also not be relied upon when making any investment decision. Any indices referenced for comparison are unmanaged and cannot be invested into directly. As always please remember investing involves risk and possible loss of principal capital; please seek advice from a licensed professional. Any projections, estimates, forecasts, targets, prospects and/or opinions expressed in these materials are subject to change without notice and may differ or be contrary to opinions expressed by others. Information in charts have been obtained from third-party sources and data, and may include those from portfolio securities of funds managed by Financial Synergies Wealth Advisors, Inc. While taken from sources believed to be reliable, Financial Synergies Wealth Advisors, Inc. has not independently verified such information and makes no representations about the enduring accuracy of the information or its appropriateness for a given situation. All content speaks only as of the date indicated.
Financial Synergies Wealth Advisors, Inc. is a registered investment adviser. Advisory services are only offered to clients or prospective clients where Financial Synergies Wealth Advisors, Inc. and its representatives are properly licensed or exempt from licensure. Investments in securities involve the risk of loss. Past performance is no guarantee of future results.
See Full Disclosures Page Here
Are We in an AI-Driven Bubble?
As markets reach new highs and artificial intelligence stocks continue to rally, some investors are asking, “Are we in an AI-driven bubble?” This is as much about investor psychology as it is about market conditions. While it’s normal to worry about bubbles, focusing too much on them can lead to counterproductive portfolio decisions that prioritize timing and short-term trading rather than long-term financial goals.
The concept of a “bubble” is often taken for granted when we talk about financial markets, but it’s actually quite hard to define what the term means. Markets naturally experience cycles, and how investors perceive risk changes over time. For every example of a bubble – including the late 1990s dot-com era and the mid-2000s housing boom – there are countless other situations when investor concerns never materialized. For example, investors constantly worried about additional bubbles after the 2008 financial crisis, only for this period to become the longest bull market on record.
So, the question of whether we are in a bubble should be distinguished from “will the stock market experience a setback?” As investors have learned from the past several years, short-term stock market declines are not only normal, but expected, and can occur without warning. Just earlier this year, the S&P 500 declined 19% but bounced back in less than three months. Many who tried to time the market during this period likely found themselves on the sidelines as the market recovered.
While the past is no guarantee of the future, the stock market has consistently made significant gains throughout history, despite periodic challenges. In this uncertain environment, how can we stay focused on building portfolios that align with our financial plans?
Valuations are high but there are important factors to keep in mind
To distinguish between short-term pullbacks and the fear of a potential bubble, it’s important to consider the concept of value. As with everything in life, what matters in investing isn’t just what price you pay but what you get for your money. After all, the reason investors buy stocks is to own a part of a business and its cash flows. Valuation metrics such as price-to-sales or price-to-earnings tell us not just the price of a share, but what we’re getting for that price.
The accompanying chart shows the Shiller price-to-earnings ratio which provides perspective on long-term valuation trends by using inflation-adjusted earnings over the past ten years. The current level of 38x, which means that investors are paying $38 for each dollar of historical earnings today, is well above the average of 27x. This has fluctuated over the past few years as markets have navigated inflation, policy uncertainty, and volatility in technology stocks.
With many measures showing that the stock market is expensive by historical standards, there are a few key points for investors to keep in mind.
First, it’s important to emphasize that valuations do not reliably predict stock market returns in the near term. Instead, they tell us how much investors are willing to pay based on their expectations about the future. Even when stocks appear expensive, markets can continue rising for months or years if business fundamentals remain strong. This is why trying to time the market can often be counterproductive.
Second, while there are parallels to the 1990s tech boom since both periods feature high valuations and excitement around new technologies, there are some key differences. Unlike the unprofitable dot-com companies of the past, current market leaders are well established, have strong profitability, and healthy balance sheets. Just as the information technology revolution ultimately benefited all types of companies over the past few decades, so too could developments in artificial intelligence.
Third, not all bubbles “pop.” While valuations can come back to Earth if prices fall, they can also improve if earnings and other fundamentals remain strong. Some of the enthusiasm experienced by the market today is in anticipation of higher future earnings. Corporate performance has justified some of these expectations in recent quarters with earnings growth coming in stronger than many had anticipated.
Opportunities exist across a range of styles and sizes
While valuations for the broad market are elevated, there are other areas that are more attractive. As the accompanying chart above shows, the price-to-earnings ratio for Large Cap Growth stocks is the highest at 28x. Other stock market sizes and styles, including Large Value and Small Caps, have more attractive valuations, even as they continue to experience healthy earnings growth.
This is true across stock market sectors as well. Artificial intelligence-related companies are primarily concentrated in the Information Technology, Communication Services, and Consumer Discretionary sectors. In recent quarters, positive trends have broadened to other sectors with more attractive valuations too, including Financials, Industrials, and more.
For investors, including a range of sizes, styles, and sectors in a portfolio not only helps reduce “concentration risk,” but can improve the overall valuations of holdings to better manage risk. It’s difficult to predict exactly which areas of the market will outperform over any given period, so holding an appropriate mix can help to improve portfolio balance.
Time remains one of the most powerful investment tools
Perhaps the most important lesson from market history is that time tends to reward patient investors, even those who invest throughout periods of high valuations. As the chart above shows, some of the most impactful market events appear less dramatic when zooming out over years and decades – time horizons that are appropriate for many investors’ financial goals. For instance, the tech and housing bubbles, while challenging at the time, both experienced recoveries as the market rose to new all-time highs.
This emphasizes the importance of not only portfolio positioning, but investment concepts that take advantage of longer timeframes such as dollar cost averaging. Even those who invested at the worst points in history, such as the 1929 market peak before the Great Depression, achieved positive returns over time. Starting during lower valuations generally produces better returns, but this advantage diminishes over extended time horizons.
Concerns over a “bubble” have grown as the market continues to reach new all-time highs, and technology stocks continue to grow in importance. Rather than focusing on what this means for the market in the short run, consider historical lessons and how they impact long-term portfolios.
The bottom line? Today’s market valuations are high due to strong earnings and business fundamentals. The key is maintaining a diversified portfolio that can benefit from growth while managing risk.
Concerns or questions about how your investment portfolio will hold up in the current market environment? Contact Financial Synergies today.
We are a boutique, financial advisory and total wealth management firm with over 35 years helping clients navigate turbulent markets. To learn more about our approach to investment management please reach out to us. One of our seasoned advisors would be happy to help you build a custom financial plan to help ensure you accomplish your financial goals and objectives. Schedule a conversation with us today.
More relevant articles by Financial Synergies:
Blog Disclosures
This content, which contains security-related opinions and/or information, is provided for informational purposes only and should not be relied upon in any manner as professional advice, or an endorsement of any practices, products or services. There can be no guarantees or assurances that the views expressed here will be applicable for any particular facts or circumstances, and should not be relied upon in any manner. You should consult your own financial advisors as to legal, business, tax, and other related matters concerning any investment.
The commentary in this “post” (including any related blogs, videos, and social media) reflects the personal opinions, viewpoints, and analyses of the Financial Synergies Wealth Advisors, Inc. employees providing such comments, and should not be regarded as the views of Financial Synergies Wealth Advisors, Inc. or its respective affiliates or as a description of advisory services provided by Financial Synergies Wealth Advisors, Inc. or performance returns of any Financial Synergies Wealth Advisors, Inc. client.
Any opinions expressed herein do not constitute or imply endorsement, sponsorship, or recommendation by Financial Synergies Wealth Advisors, Inc. or its employees. The views reflected in the commentary are subject to change at any time without notice.
Nothing on this website constitutes investment or financial planning advice, performance data or any recommendation that any particular security, portfolio of securities, transaction or investment strategy is suitable for any specific person. It also should not be construed as an offer soliciting the purchase or sale of any security mentioned. Nor should it be construed as an offer to provide investment advisory services by Financial Synergies Wealth Advisors, Inc.
Any mention of a particular security and related performance data is not a recommendation to buy or sell that security. Financial Synergies Wealth Advisors, Inc. manages its clients’ accounts using a variety of investment techniques and strategies, which are not necessarily discussed in the commentary. Investments in securities involve the risk of loss. Past performance is no guarantee of future results.
Any charts provided here or on any related Financial Synergies Wealth Advisors, Inc. personnel content outlets are for informational purposes only, and should also not be relied upon when making any investment decision. Any indices referenced for comparison are unmanaged and cannot be invested into directly. As always please remember investing involves risk and possible loss of principal capital; please seek advice from a licensed professional. Any projections, estimates, forecasts, targets, prospects and/or opinions expressed in these materials are subject to change without notice and may differ or be contrary to opinions expressed by others. Information in charts have been obtained from third-party sources and data, and may include those from portfolio securities of funds managed by Financial Synergies Wealth Advisors, Inc. While taken from sources believed to be reliable, Financial Synergies Wealth Advisors, Inc. has not independently verified such information and makes no representations about the enduring accuracy of the information or its appropriateness for a given situation. All content speaks only as of the date indicated.
Financial Synergies Wealth Advisors, Inc. is a registered investment adviser. Advisory services are only offered to clients or prospective clients where Financial Synergies Wealth Advisors, Inc. and its representatives are properly licensed or exempt from licensure. Investments in securities involve the risk of loss. Past performance is no guarantee of future results.
See Full Disclosures Page Here
Recent Posts
Bond Markets Are Quietly Pulling Their Weight in 2025
Your 2025 Year End Tax Planning Checklist
Monthly Market Update: Markets Digest the Path of Interest Rates & the Next Phase of the AI Cycle
Subscribe to Our Blog
Shareholder | Chief Investment Officer