Markets Have Great 1st Quarter
Global equity markets had a terrific first quarter – and the gains were generally across the board as the tech-names, large-caps, mega-caps and small caps all advanced handsomely.
If you would prefer to download a PDF copy of this report, one is provided here: 1st Quarter 2024 Market Review PDF
1st Quarter 2024 Market Review
By all accounts, U.S. and global equities are off to a fast start in 2024, building on the terrific performance from the final quarter of 2023. And while there were a lot of milestones to celebrate, with the DJIA, S&P 500 and NASDAQ breaching new highs, it was also the biggest first-quarter gain for the S&P 500 since 2019.
For the first quarter of 2024:
- The DJIA advanced 5.6%
- The S&P 500 gained 10.8%
- NASDAQ jumped 10.9%
- The Russell 2000 leapt 5.6%
The themes that drove market performance in the first quarter continued to center around inflation, the Fed, the housing market, good corporate earnings, and the labor market, with recent economic data suggesting that inflation might be stickier than previously hoped, adding worries that the Fed might not begin its rate-cutting until later this summer.
The other big theme that really took off this quarter (and previous ones too) was the developments in generative artificial intelligence stocks, with AI chipmaker Nvidia as the poster-child for this space as it leapt almost 88% this past quarter. But it wasn’t just Nvidia, Super Micro Computer’s stock ended the quarter up a staggering 250%.
Further, we saw that:
- Volatility, as measured by the VIX, trended slightly down this quarter, losing about 1.4% and ending the quarter just north of 13, although there were a few 10% spikes throughout the quarter.
- West Texas Intermediate crude trended up significantly for the first quarter, gaining $12.73/barrel and ending the quarter at $83.11. For comparison, this time last year, crude prices were about $9 less per barrel.
Market Performance Around the World
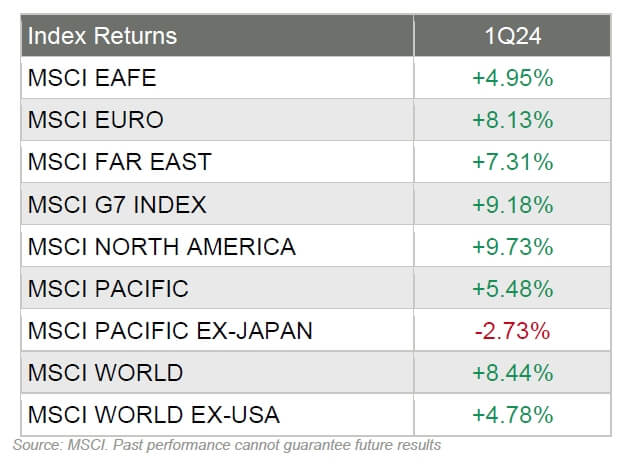
Investors were happy with the quarterly performance around the world too, as 34 of the 36 developed markets tracked by MSCI were green for the first quarter of 2024. And for the 40 developing markets tracked by MSCI, 27 were positive, with the vast majority gaining almost 5%.
Sector Performance Rotated in Q1 2024
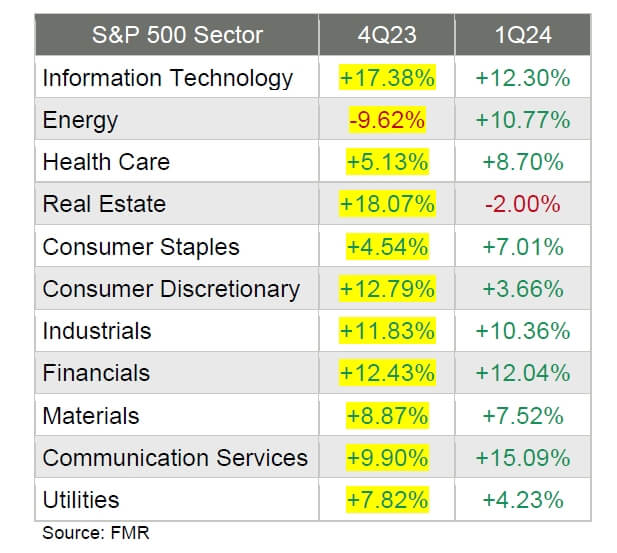
The overall sector performance for the first quarter was very good, In fact, only one sector declined (Real Estate) whereas the other 10 all jumped markedly. Interestingly, this was what happened last quarter when the Energy sector (-9.62%) was the only one to retreat.
Given the robust performance of the previous quarter, only 3 sectors improved on a relative basis, but the net positive performance numbers were still very strong. In fact, considering that 5 sectors advanced by more than 10% in Q1, many of the gains over the past two consecutive quarters are downright exceptional.
Here are the sector returns for the first quarter of 2024 and the fourth quarter of 2023:
Reviewing the sector returns for just the 1st quarter of 2024, we saw that:
- 10 of the 11 sectors were painted green, with only the Real Estate sector declining as rates stayed high and properties remained on the market for longer during the quarter;
- The tech-laden sectors – think Information Technology and Communication Services turned in exceptional back-to-back quarters.
- The Energy sector saw a very large swing from Q4 to Q1, losing almost 10% last quarter and gaining over 10% this quarter.
- The differences between the best (+15%) performing and worst (-2%) performing sectors in the first quarter was very wide.
The Federal Reserve and Rates
At the center of the Wall Street’s collective attention was the Fed, where our central bank decided to leave rates unchanged – much to no one’s surprise. What was surprising – or maybe just encouraging – was when Fed Chair Jerome Powell assured Wall Street and Main Street that rate cuts were indeed coming, despite reports of hotter-than-expected inflation readings, most notably last month’s CPI and PPI numbers.
From the Fed’s statement: “Recent indicators suggest that economic activity has been expanding at a solid pace. Job gains have remained strong, and the unemployment rate has remained low. Inflation has eased over the past year but remains elevated.
The Committee does not expect it will be appropriate to reduce the target range until it has gained greater confidence that inflation is moving sustainably toward 2 percent. In addition, the Committee will continue reducing its holdings of Treasury securities and agency debt and agency mortgage-backed securities, as described in its previously announced plans.”
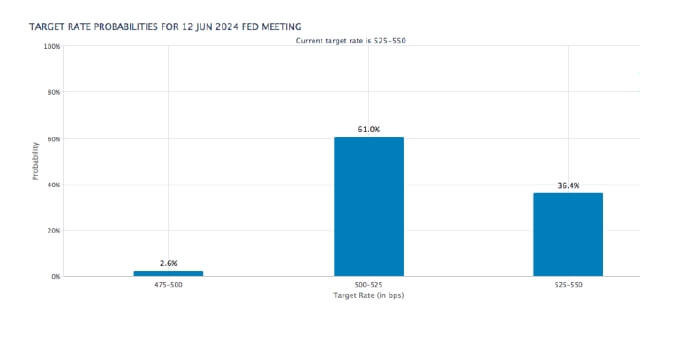
Wall Street is expecting three rate cuts this year, with the first happening in June. But late in the month, Fed Governor Waller said “there is no rush to cut the policy rate right now,” dampening expectations a little bit. Time will tell.
Another Social Media Stock Boom?
Reddit launched an IPO late in the quarter and the stock soared by as much as 70%, before closing up about 50% on its first day of trading. It was the first “major” social media company to debut an IPO since Pinterest in 2019. And shares of former President Donald Trump’s newly merged and publicly traded social media company, Trump Media, also leapt about 50% on its first day of trading too.
The Bitcoin Bull
Late in the quarter, Bitcoin hit its highest price ever – over $72,000 – after the UK said it would allow investment exchanges to list crypto-linked exchange-traded notes (or ETNs) for professional investors.
This is on the heels of the January approval of spot bitcoin ETFs by the U.S. Securities and Exchange Commission, which opened the cryptocurrency market to new investors who wanted to trade the digital coins.
Price of Bitcoin

Earnings Report
On the last day of the quarter, research firm FactSet reported that:
- For Q1 2024, the estimated (year-over-year) earnings growth rate for the S&P 500 is 3.6%. If 3.6% is the actual growth rate for the quarter, it will mark the third-straight quarter of year-over-year earnings growth for the index.
- On December 31, the estimated (year-over- year) earnings growth rate for the S&P 500 for Q1 2024 was 5.8%. Seven sectors are expected to report lower earnings today (compared to December 31) due to downward revisions to EPS estimates.
- For Q1 2024, 79 S&P 500 companies have issued negative EPS guidance and 33 S&P 500 companies have issued positive EPS guidance.
- The forward 12-month P/E ratio for the S&P 500 is 20.9. This P/E ratio is above the 5-year average (19.1) and above the 10-year average (17.7).
GDP Up 3.4% Last Quarter
Real gross domestic product increased at an annual rate of 3.4% in the fourth quarter of 2023 according to the “third” estimate released by the Bureau of Economic Analysis. In the third quarter, real GDP increased 4.9%. In the second estimate, the increase in real GDP was 3.2%.
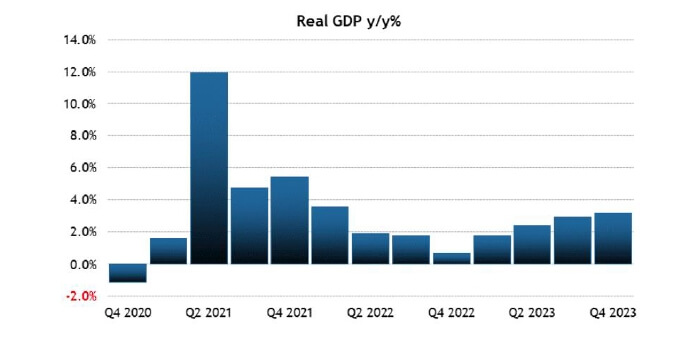
The increase in real GDP primarily reflected increases in consumer spending, state and local government spending, exports, nonresidential fixed investment, federal government spending, and residential fixed investment that were partly offset by a decrease in private inventory investment. Imports, which are a subtraction in the calculation of GDP, increased.
Retail Sales Up
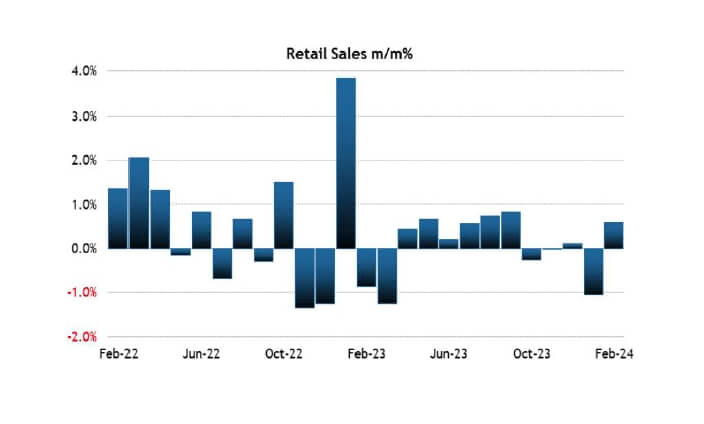
Mid-month, it was reported that U.S. retail and food services sales for February 2024 were $700.7 billion, up 0.6% from the previous month, and up 1.5% above February 2023. Total sales for the December 2023 through February 2024 period were up 2.1% from the same period a year ago.
Retail trade sales were up 0.6% from January 2024, and up 0.8% above last year. Non-store retailers were up 6.4% from last year, while food services and drinking places were up 6.3% from February 2023.
Consumers Worried About Future
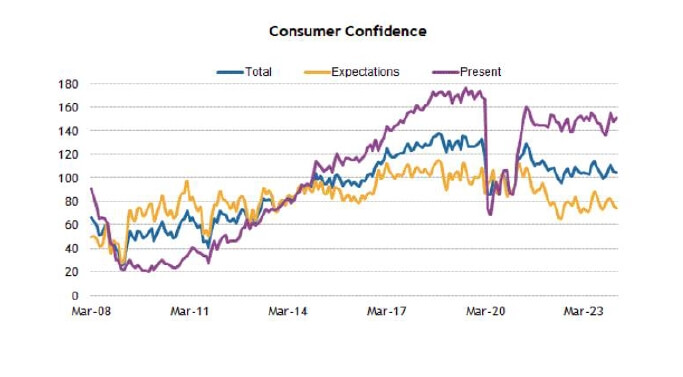
The Conference Board Consumer Confidence Index was 104.7 (1985=100) in March, essentially unchanged from a downwardly revised 104.8 in February.
- The Present Situation Index – based on consumers’ assessment of current business and labor market conditions – increased to 151.0 (1985=100) in March from 147.6 in February.
- The Expectations Index – based on consumers’ short-term outlook for income, business, and labor market conditions – fell to 73.8 (1985=100), down from 76.3 last month. An Expectations Index reading below 80 often signals a forthcoming recession.
“Consumers’ assessment of the present situation improved in March, but they also became more pessimistic about the future. Confidence rose among consumers aged 55 and over but deteriorated for those under 55. Separately, consumers in the $50,000-$99,999 income group reported lower confidence in March, while confidence improved slightly in all other income groups. However, over the last six months, confidence has been moving sideways with no real trend to the upside or downside either by income or age group.”
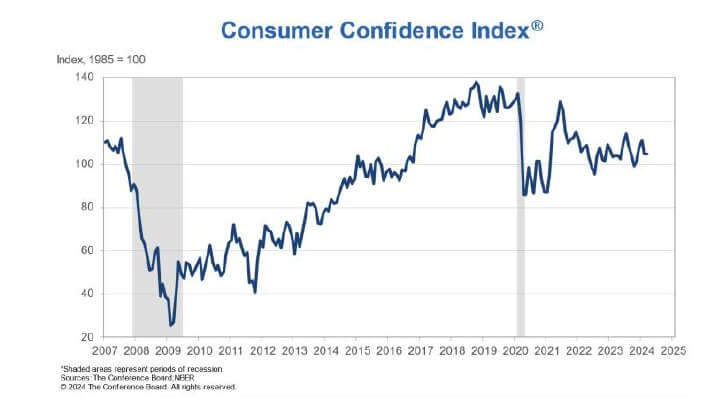
“Consumers remained concerned with elevated price levels, which predominated write-in responses. March’s write-in responses showed an uptick in concerns about food and gas prices, but in general complaints about gas prices have been trending downward. Indeed, average 12-month inflation expectations came in at 5.3 percent – barely changed from February’s four-year low of 5.2 percent. Recession fears continued to trend downward both in write-in responses and as measured by consumers’ Perceived Likelihood of a US Recession over the Next 12 Months.”
Present Situation
Consumers’ assessment of current business conditions fell slightly in March.
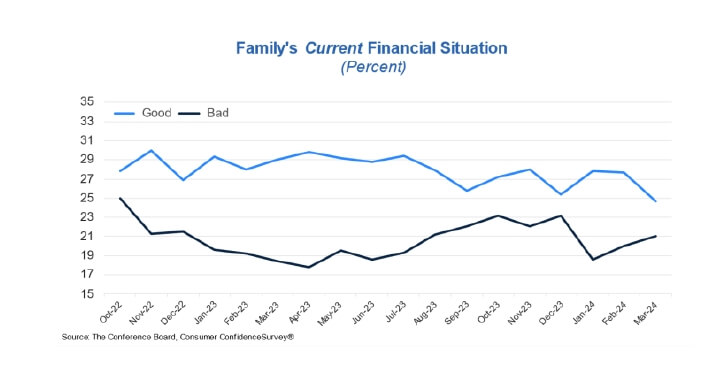
- 5% of consumers said business conditions were “good,” down from 20.4% in February.
- 2% said business conditions were “bad,” down from 17.7%.
Consumers’ appraisal of the labor market was more positive in March.
- 1% of consumers said jobs were “plentiful,” up from 42.8% in February.
- 9% of consumers said jobs were “hard to get,” down from 12.7%.
New Home Sales Slip
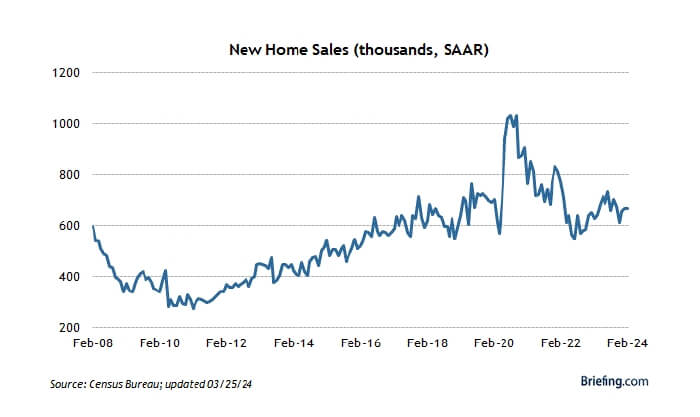
New home sales decreased 0.3% month-over-month in February to a seasonally adjusted annual rate of 662,000 units in January. On a year-over-year basis, new home sales were up 5.9%.
Further:
- The median sales price decreased 7.6% yr/yr to $400,500 while the average sales price fell 2.8% to $485,000. February marked the sixth consecutive month of a year-over-year decline in the median selling price.
- New home sales month-over-month/year- over-year by region: Northeast (-31.5%; +60.9%); Midwest (-2.4%; +15.3%); South (+3.7%; -10.0%); and West (+2.3%; +43.4%).
- At the current sales pace, the supply of new homes for sale stood at 8.4 months, versus 8.3 months in January and 8.4 months in February 2023.
- The percentage of new homes sold for $399,999 or less accounted for 50% of new homes sold versus 44% in January and 42% one year ago. Homes priced between $400,000 and $749,000 accounted for 38% of new homes sold versus 42% in January. New homes priced at $750,000 or over accounted for 11% of sales in February versus 13% in January.
Leading Economic Indicators Inch Up
The Conference Board Leading Economic Index for the U.S. increased by 0.1 percent in February 2024 to 102.8 (2016=100), following a 0.4 percent decline in January. Over the six-month period between August 2023 and February 2024, the LEI contracted by 2.6 percent – a smaller decrease than the 3.8 percent decline over the previous six months.
“The U.S. LEI rose in February 2024 for the first time since February 2022. Strength in weekly hours worked in manufacturing, stock prices, the Leading Credit Index, and residential construction drove the LEI’s first monthly increase in two years. However, consumers’ expectations and the ISM Index of New Orders have yet to recover, and the six- and twelve- month growth rates of the LEI remain negative.
Despite February’s increase, the Index still suggests some headwinds to growth going forward. The Conference Board expects annualized US GDP growth to slow over the Q2 to Q3 2024 period, as rising consumer debt and elevated interest rates weigh on consumer spending.”
Bottom Line:
By any measure, this was a fantastic quarter. The markets and economy continue to show resiliency in the face of somewhat sticky inflation, elevated rates, and the persistent, “when will the Fed lower rates?” question.
Concerns or questions about how your investment portfolio will hold up in the current market environment? Contact Financial Synergies today.
We are a boutique, financial advisory and total wealth management firm with over 35 years helping clients navigate turbulent markets. To learn more about our approach to investment management please reach out to us. One of our seasoned advisors would be happy to help you build a custom financial plan to help ensure you accomplish your financial goals and objectives. Schedule a conversation with us today.
More relevant articles by Financial Synergies:
1st Quarter 2024 Market Review
Markets Have Great 1st Quarter
Global equity markets had a terrific first quarter – and the gains were generally across the board as the tech-names, large-caps, mega-caps and small caps all advanced handsomely.
If you would prefer to download a PDF copy of this report, one is provided here: 1st Quarter 2024 Market Review PDF
1st Quarter 2024 Market Review
By all accounts, U.S. and global equities are off to a fast start in 2024, building on the terrific performance from the final quarter of 2023. And while there were a lot of milestones to celebrate, with the DJIA, S&P 500 and NASDAQ breaching new highs, it was also the biggest first-quarter gain for the S&P 500 since 2019.
For the first quarter of 2024:
The themes that drove market performance in the first quarter continued to center around inflation, the Fed, the housing market, good corporate earnings, and the labor market, with recent economic data suggesting that inflation might be stickier than previously hoped, adding worries that the Fed might not begin its rate-cutting until later this summer.
The other big theme that really took off this quarter (and previous ones too) was the developments in generative artificial intelligence stocks, with AI chipmaker Nvidia as the poster-child for this space as it leapt almost 88% this past quarter. But it wasn’t just Nvidia, Super Micro Computer’s stock ended the quarter up a staggering 250%.
Further, we saw that:
Market Performance Around the World
Investors were happy with the quarterly performance around the world too, as 34 of the 36 developed markets tracked by MSCI were green for the first quarter of 2024. And for the 40 developing markets tracked by MSCI, 27 were positive, with the vast majority gaining almost 5%.
Sector Performance Rotated in Q1 2024
The overall sector performance for the first quarter was very good, In fact, only one sector declined (Real Estate) whereas the other 10 all jumped markedly. Interestingly, this was what happened last quarter when the Energy sector (-9.62%) was the only one to retreat.
Given the robust performance of the previous quarter, only 3 sectors improved on a relative basis, but the net positive performance numbers were still very strong. In fact, considering that 5 sectors advanced by more than 10% in Q1, many of the gains over the past two consecutive quarters are downright exceptional.
Here are the sector returns for the first quarter of 2024 and the fourth quarter of 2023:
Reviewing the sector returns for just the 1st quarter of 2024, we saw that:
The Federal Reserve and Rates
At the center of the Wall Street’s collective attention was the Fed, where our central bank decided to leave rates unchanged – much to no one’s surprise. What was surprising – or maybe just encouraging – was when Fed Chair Jerome Powell assured Wall Street and Main Street that rate cuts were indeed coming, despite reports of hotter-than-expected inflation readings, most notably last month’s CPI and PPI numbers.
From the Fed’s statement: “Recent indicators suggest that economic activity has been expanding at a solid pace. Job gains have remained strong, and the unemployment rate has remained low. Inflation has eased over the past year but remains elevated.
The Committee does not expect it will be appropriate to reduce the target range until it has gained greater confidence that inflation is moving sustainably toward 2 percent. In addition, the Committee will continue reducing its holdings of Treasury securities and agency debt and agency mortgage-backed securities, as described in its previously announced plans.”
Wall Street is expecting three rate cuts this year, with the first happening in June. But late in the month, Fed Governor Waller said “there is no rush to cut the policy rate right now,” dampening expectations a little bit. Time will tell.
Another Social Media Stock Boom?
Reddit launched an IPO late in the quarter and the stock soared by as much as 70%, before closing up about 50% on its first day of trading. It was the first “major” social media company to debut an IPO since Pinterest in 2019. And shares of former President Donald Trump’s newly merged and publicly traded social media company, Trump Media, also leapt about 50% on its first day of trading too.
The Bitcoin Bull
Late in the quarter, Bitcoin hit its highest price ever – over $72,000 – after the UK said it would allow investment exchanges to list crypto-linked exchange-traded notes (or ETNs) for professional investors.
This is on the heels of the January approval of spot bitcoin ETFs by the U.S. Securities and Exchange Commission, which opened the cryptocurrency market to new investors who wanted to trade the digital coins.
Price of Bitcoin
Earnings Report
On the last day of the quarter, research firm FactSet reported that:
GDP Up 3.4% Last Quarter
Real gross domestic product increased at an annual rate of 3.4% in the fourth quarter of 2023 according to the “third” estimate released by the Bureau of Economic Analysis. In the third quarter, real GDP increased 4.9%. In the second estimate, the increase in real GDP was 3.2%.
The increase in real GDP primarily reflected increases in consumer spending, state and local government spending, exports, nonresidential fixed investment, federal government spending, and residential fixed investment that were partly offset by a decrease in private inventory investment. Imports, which are a subtraction in the calculation of GDP, increased.
Retail Sales Up
Mid-month, it was reported that U.S. retail and food services sales for February 2024 were $700.7 billion, up 0.6% from the previous month, and up 1.5% above February 2023. Total sales for the December 2023 through February 2024 period were up 2.1% from the same period a year ago.
Retail trade sales were up 0.6% from January 2024, and up 0.8% above last year. Non-store retailers were up 6.4% from last year, while food services and drinking places were up 6.3% from February 2023.
Consumers Worried About Future
The Conference Board Consumer Confidence Index was 104.7 (1985=100) in March, essentially unchanged from a downwardly revised 104.8 in February.
“Consumers’ assessment of the present situation improved in March, but they also became more pessimistic about the future. Confidence rose among consumers aged 55 and over but deteriorated for those under 55. Separately, consumers in the $50,000-$99,999 income group reported lower confidence in March, while confidence improved slightly in all other income groups. However, over the last six months, confidence has been moving sideways with no real trend to the upside or downside either by income or age group.”
“Consumers remained concerned with elevated price levels, which predominated write-in responses. March’s write-in responses showed an uptick in concerns about food and gas prices, but in general complaints about gas prices have been trending downward. Indeed, average 12-month inflation expectations came in at 5.3 percent – barely changed from February’s four-year low of 5.2 percent. Recession fears continued to trend downward both in write-in responses and as measured by consumers’ Perceived Likelihood of a US Recession over the Next 12 Months.”
Present Situation
Consumers’ assessment of current business conditions fell slightly in March.
Consumers’ appraisal of the labor market was more positive in March.
New Home Sales Slip
New home sales decreased 0.3% month-over-month in February to a seasonally adjusted annual rate of 662,000 units in January. On a year-over-year basis, new home sales were up 5.9%.
Further:
Leading Economic Indicators Inch Up
The Conference Board Leading Economic Index for the U.S. increased by 0.1 percent in February 2024 to 102.8 (2016=100), following a 0.4 percent decline in January. Over the six-month period between August 2023 and February 2024, the LEI contracted by 2.6 percent – a smaller decrease than the 3.8 percent decline over the previous six months.
“The U.S. LEI rose in February 2024 for the first time since February 2022. Strength in weekly hours worked in manufacturing, stock prices, the Leading Credit Index, and residential construction drove the LEI’s first monthly increase in two years. However, consumers’ expectations and the ISM Index of New Orders have yet to recover, and the six- and twelve- month growth rates of the LEI remain negative.
Despite February’s increase, the Index still suggests some headwinds to growth going forward. The Conference Board expects annualized US GDP growth to slow over the Q2 to Q3 2024 period, as rising consumer debt and elevated interest rates weigh on consumer spending.”
Bottom Line:
By any measure, this was a fantastic quarter. The markets and economy continue to show resiliency in the face of somewhat sticky inflation, elevated rates, and the persistent, “when will the Fed lower rates?” question.
Concerns or questions about how your investment portfolio will hold up in the current market environment? Contact Financial Synergies today.
We are a boutique, financial advisory and total wealth management firm with over 35 years helping clients navigate turbulent markets. To learn more about our approach to investment management please reach out to us. One of our seasoned advisors would be happy to help you build a custom financial plan to help ensure you accomplish your financial goals and objectives. Schedule a conversation with us today.
More relevant articles by Financial Synergies:
Recent Posts
Why Are Markets So Volatile Recently?
Week in Perspective: Stocks Stage a Comeback [Apr. 29-2024] – Video
Social Security and Your Spouse
Subscribe to Our Blog
Shareholder | Chief Investment Officer