As August begins, the economic recovery is sending mixed signals. This is primarily due to the accelerating number of COVID-19 cases in many parts of the country which has sparked increased restrictions by governments and businesses. This means that many of the economic numbers will vary from region to region, following the overall trends of the disease. Despite this, there are still signs that the economy is getting back on track. At the very least, the data suggest that the worst is behind us at a national level, and jobs can slowly return as local businesses find their footing.
In particular, last week’s GDP data for the second quarter showed that the economy suffered its worst decline in history over those three months. On an annualized basis, the economy shrank by 32.9%, worse than any quarter during the Great Depression nearly a century ago. However, it’s important to keep a few facts in mind when interpreting these statistics.
First, we often annualize economic numbers in order to understand trends. Normalizing the data helps us to better compare measurements by imagining what would have happened had these events been stretched out to a whole year.
In this case, the magnitude of this GDP decline is not expected to last a full year since the worst likely occurred during April and May. The actual quarterly decline was 9.5% – both compared to the first quarter and compared to the same quarter a year ago. While this is still terrible, it can’t truly be compared to the Great Depression which lasted a decade and technically consisted of two economic cycles.
Second, the GDP numbers are naturally backward-looking since they are only released quarterly with a lag. The reason that many stocks continue to reach all-time highs is because these numbers were widely anticipated. In fact, the consensus forecast for a 34.5% decline was nearly right on point, not to mention we already knew that a new economic cycle began in March according to the National Bureau of Economic Research.
This doesn’t mean that this data isn’t useful since it does help to confirm the magnitude of the economic decline from shutting down businesses across the country for months. However, other weekly and monthly economic data not only gave us a good indication of how the economy was doing, but will tell us more about the future as well.
Finally, the GDP numbers don’t take into account what we’ve learned since the economy was in free-fall: that businesses can successfully reopen and the economic numbers can improve. Of course, this is highly dependent on the public health trends.
Going forward, if businesses can continue to run and expand their operations – even at partial capacity – jobs can return and corporate profits can recover. There were clear signs of this in the jobs data during May and June when even weekly jobless claims were improving.
Even if it takes time for retail sector jobs to return, there are signs that business and industrial activity has picked up. Various manufacturing and non-manufacturing levels are now rising at pre-crisis rates – a positive sign for the rest of this year and into 2021.
As expected, corporate profits are trending with the economy. It’s estimated that earnings fell between 35 to 40% during the second quarter (they are still being reported) and will decline in 2020 by about 22%. However, estimates also suggest that corporate profits will return to pre-crisis levels by the end of 2021.
While a lost two-year period of profits growth is not what anyone would want, some perspective is needed. This is occurring after the worst quarterly economic decline in history and may be less than the four-year period of flat profits after the 2008 financial crisis.
Ultimately, it’s important to see through this interim period in order to benefit from the economic recovery. After all, financial markets are forward-looking and react to these trends even as they are happening. This is one reason that stocks have performed well over the past few months despite the on-going crisis. Thus, it’s important for investors to maintain discipline and not over-react to backward-looking data in the coming months.
Below are three charts that put recent economic trends in perspective.
1. The economy has experienced its worst decline in history
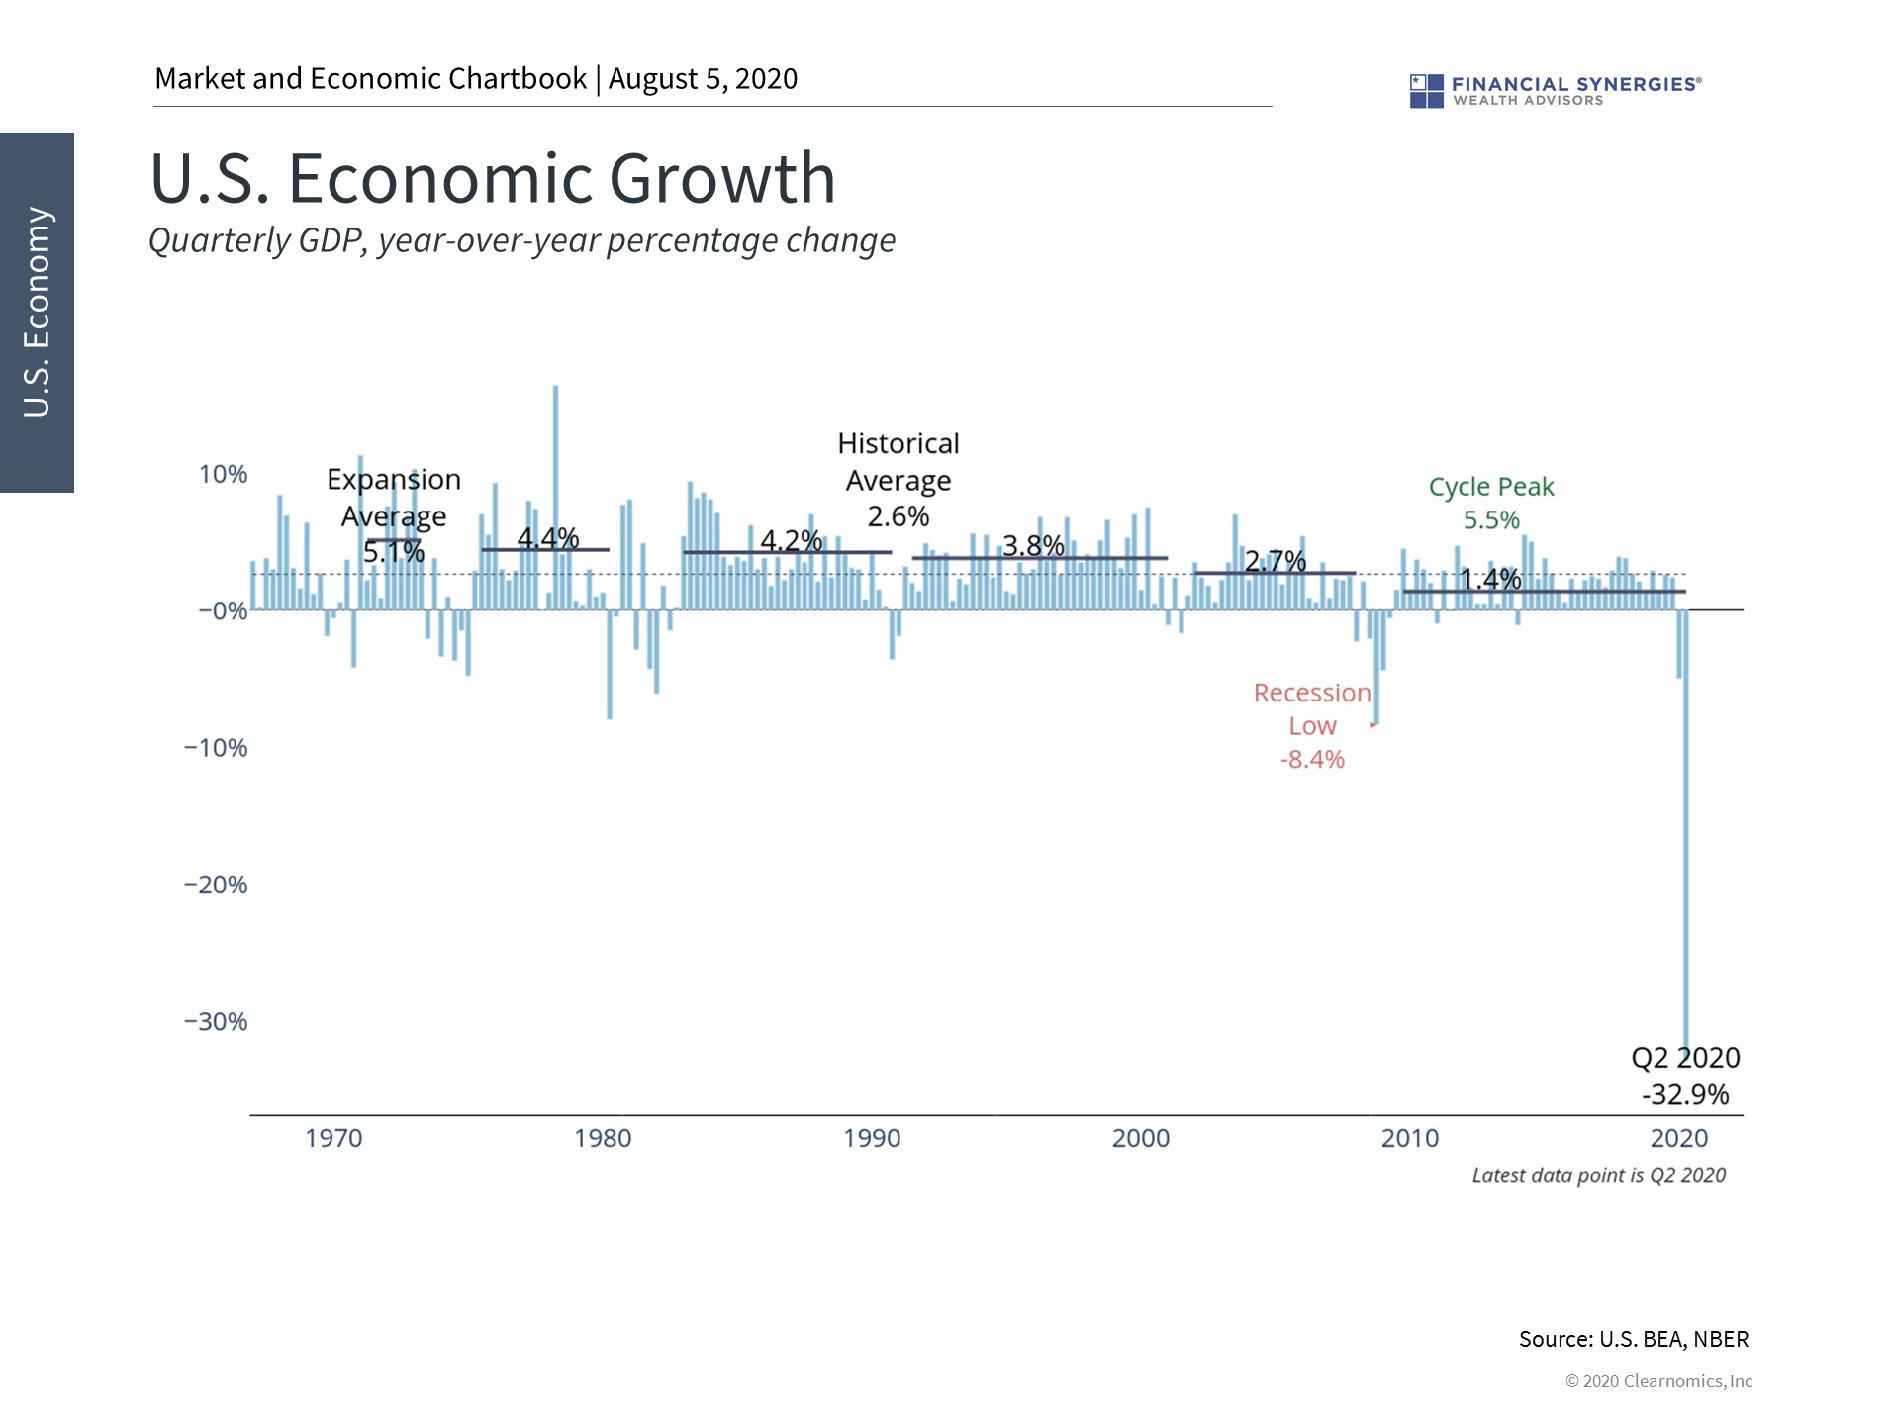
The Q2 GDP decline was the worst in history. The economy fell 32.9% at an annualized rate or 9.5% on a quarterly basis. Still, unlike in prior recessions and depressions, this is not expected to continue at this pace. There are already many signs that the economy is rebounding, even if the pace is uncertain due to the on-going COVID-19 crisis.
2. However, the recovery is still continuing

Other data show that activity has been returning since the economic bottom. The ISM manufacturing and non-manufacturing indices both show that business activity has returned to a healthier pace. While these numbers will depend on how local governments and businesses deal with COVID-19 outbreaks, the overall trends are positive.
3. Profits are expected to take two years to recover
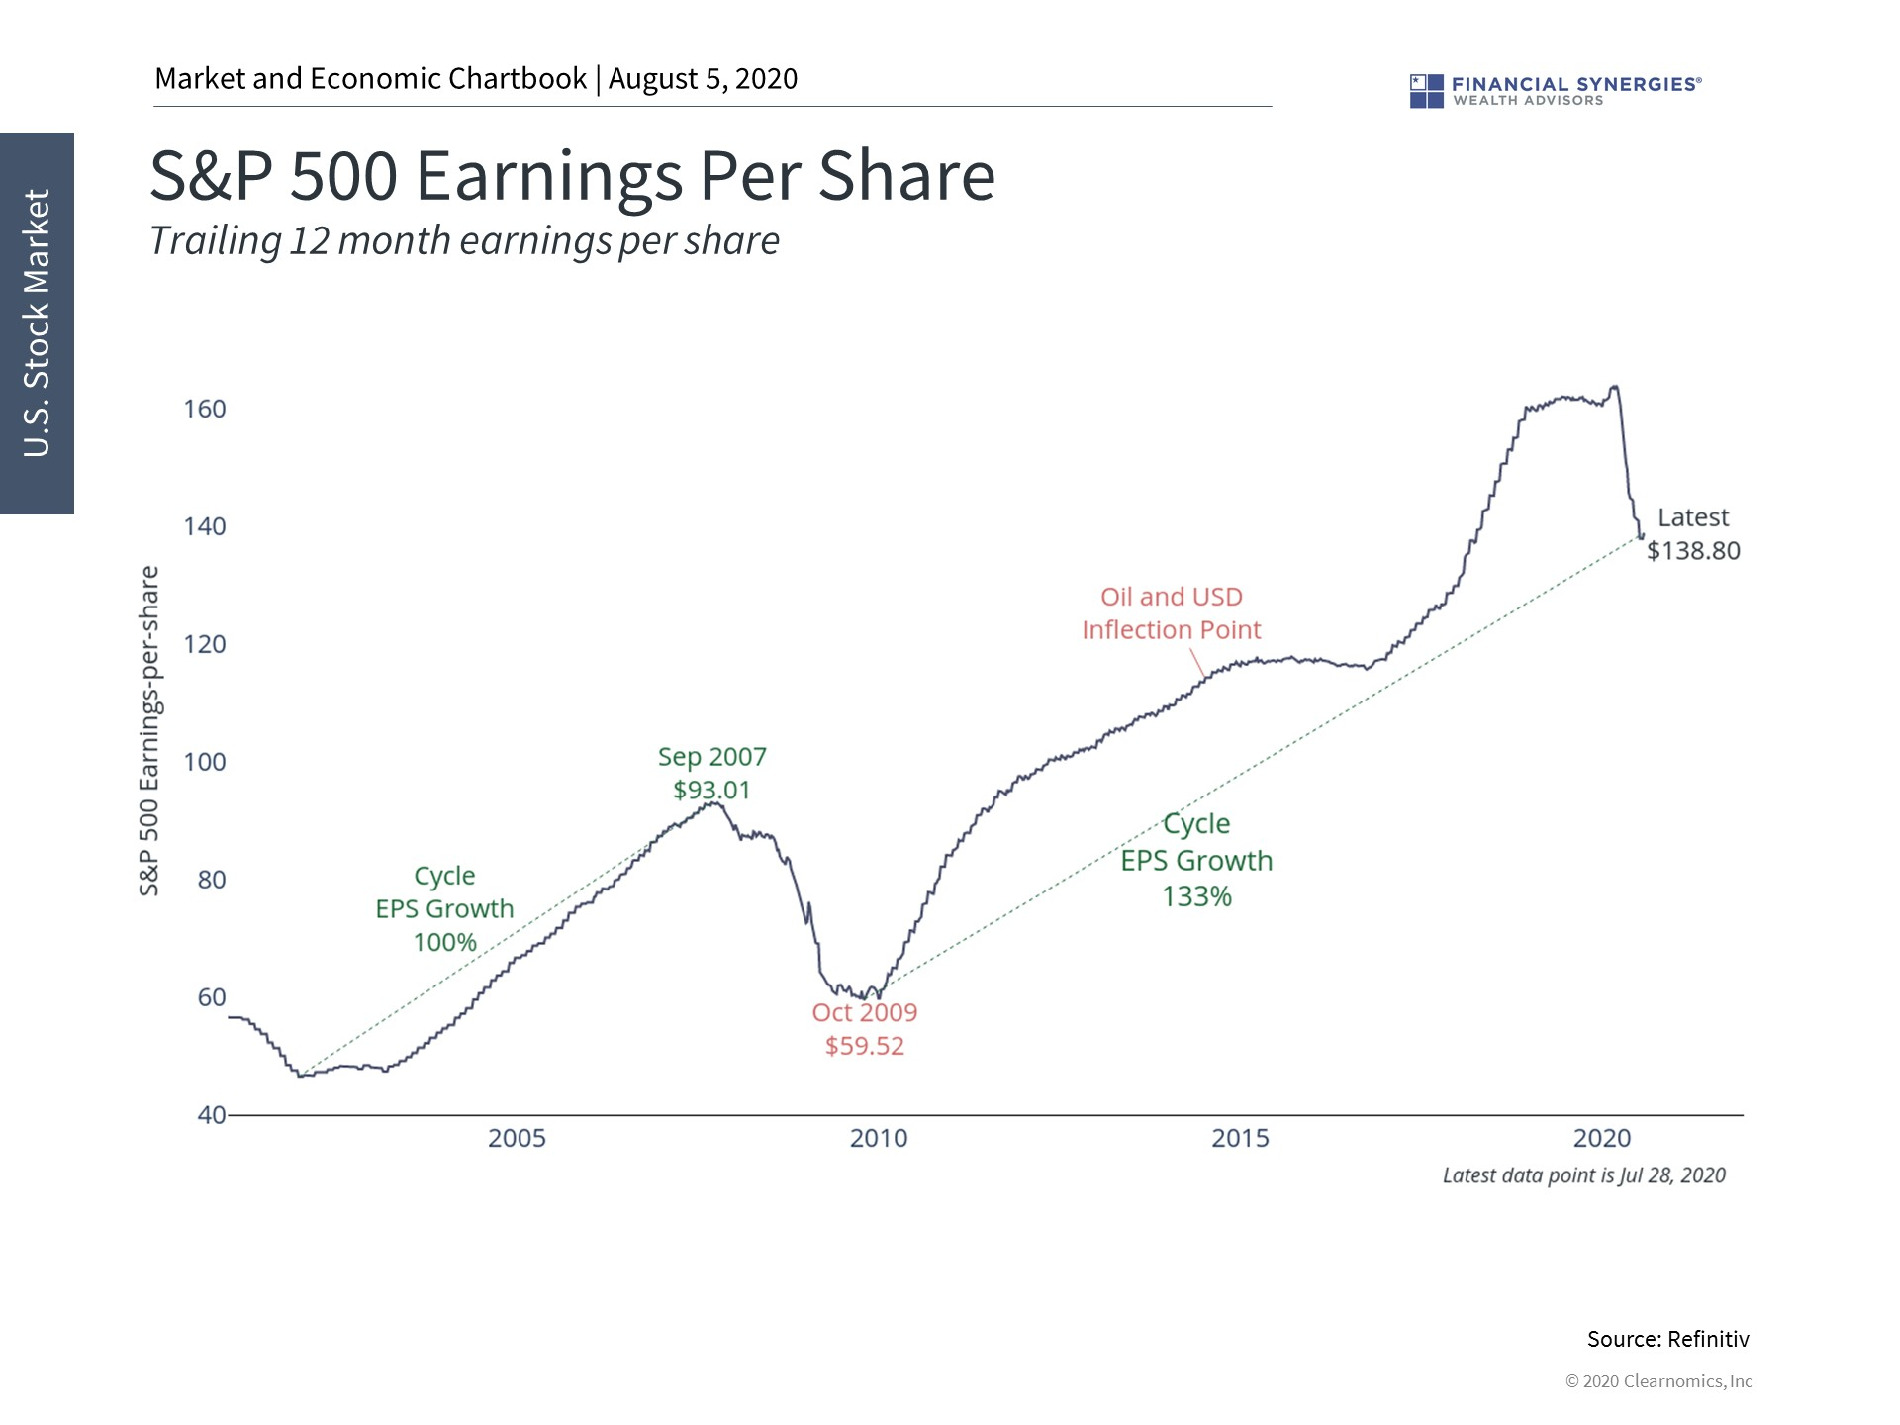
In the end, what matters to investors is how the economic data affect corporate earnings. So far, earnings have trended with the economy. Profits are expected to recover in the second half of the year and into 2021. This trend is one reason that stocks have recovered in recent months.
While the Q2 GDP report was the worst in history, this was widely expected. There are many signs that the economy has been recovering since then and will continue to do so through 2021. Stay tuned!
Source: Clearnomics
Worst GDP Decline in History
As August begins, the economic recovery is sending mixed signals. This is primarily due to the accelerating number of COVID-19 cases in many parts of the country which has sparked increased restrictions by governments and businesses. This means that many of the economic numbers will vary from region to region, following the overall trends of the disease. Despite this, there are still signs that the economy is getting back on track. At the very least, the data suggest that the worst is behind us at a national level, and jobs can slowly return as local businesses find their footing.
In particular, last week’s GDP data for the second quarter showed that the economy suffered its worst decline in history over those three months. On an annualized basis, the economy shrank by 32.9%, worse than any quarter during the Great Depression nearly a century ago. However, it’s important to keep a few facts in mind when interpreting these statistics.
First, we often annualize economic numbers in order to understand trends. Normalizing the data helps us to better compare measurements by imagining what would have happened had these events been stretched out to a whole year.
In this case, the magnitude of this GDP decline is not expected to last a full year since the worst likely occurred during April and May. The actual quarterly decline was 9.5% – both compared to the first quarter and compared to the same quarter a year ago. While this is still terrible, it can’t truly be compared to the Great Depression which lasted a decade and technically consisted of two economic cycles.
Second, the GDP numbers are naturally backward-looking since they are only released quarterly with a lag. The reason that many stocks continue to reach all-time highs is because these numbers were widely anticipated. In fact, the consensus forecast for a 34.5% decline was nearly right on point, not to mention we already knew that a new economic cycle began in March according to the National Bureau of Economic Research.
This doesn’t mean that this data isn’t useful since it does help to confirm the magnitude of the economic decline from shutting down businesses across the country for months. However, other weekly and monthly economic data not only gave us a good indication of how the economy was doing, but will tell us more about the future as well.
Finally, the GDP numbers don’t take into account what we’ve learned since the economy was in free-fall: that businesses can successfully reopen and the economic numbers can improve. Of course, this is highly dependent on the public health trends.
Going forward, if businesses can continue to run and expand their operations – even at partial capacity – jobs can return and corporate profits can recover. There were clear signs of this in the jobs data during May and June when even weekly jobless claims were improving.
Even if it takes time for retail sector jobs to return, there are signs that business and industrial activity has picked up. Various manufacturing and non-manufacturing levels are now rising at pre-crisis rates – a positive sign for the rest of this year and into 2021.
As expected, corporate profits are trending with the economy. It’s estimated that earnings fell between 35 to 40% during the second quarter (they are still being reported) and will decline in 2020 by about 22%. However, estimates also suggest that corporate profits will return to pre-crisis levels by the end of 2021.
While a lost two-year period of profits growth is not what anyone would want, some perspective is needed. This is occurring after the worst quarterly economic decline in history and may be less than the four-year period of flat profits after the 2008 financial crisis.
Ultimately, it’s important to see through this interim period in order to benefit from the economic recovery. After all, financial markets are forward-looking and react to these trends even as they are happening. This is one reason that stocks have performed well over the past few months despite the on-going crisis. Thus, it’s important for investors to maintain discipline and not over-react to backward-looking data in the coming months.
Below are three charts that put recent economic trends in perspective.
1. The economy has experienced its worst decline in history
The Q2 GDP decline was the worst in history. The economy fell 32.9% at an annualized rate or 9.5% on a quarterly basis. Still, unlike in prior recessions and depressions, this is not expected to continue at this pace. There are already many signs that the economy is rebounding, even if the pace is uncertain due to the on-going COVID-19 crisis.
2. However, the recovery is still continuing
Other data show that activity has been returning since the economic bottom. The ISM manufacturing and non-manufacturing indices both show that business activity has returned to a healthier pace. While these numbers will depend on how local governments and businesses deal with COVID-19 outbreaks, the overall trends are positive.
3. Profits are expected to take two years to recover
In the end, what matters to investors is how the economic data affect corporate earnings. So far, earnings have trended with the economy. Profits are expected to recover in the second half of the year and into 2021. This trend is one reason that stocks have recovered in recent months.
While the Q2 GDP report was the worst in history, this was widely expected. There are many signs that the economy has been recovering since then and will continue to do so through 2021. Stay tuned!
Source: Clearnomics
Recent Posts
Your “Magic” Retirement Number?
The Market Pullback, Geopolitical Risks, Inflation, and More
Week in Perspective: Stocks Startled by Inflation, Conflict [Apr. 15-2024] – VIDEO
Subscribe to Our Blog
Shareholder | Chief Investment Officer